The UK’s flight addiction is paused. The only safe recovery is a synthetic jet fuel revolution

(This article was published in Business Green on June 24th 2020. Many thanks to Ned Molloy for all his help).

The Coronavirus lockdown, including the shutdown of most air travel, cut global carbon emissions a whopping 17% at the peak of the confinement in April, compared to a year earlier.

This pause is a good time to reflect on our “flight privilege”. Astonishingly, more British people took flights abroad pre-crisis than from any other country in the world. If you feel it’s unfair you can’t fly abroad this year, just remember that you’re now, temporarily, in the normal situation for 80% of humanity that has never stepped foot on a plane in their life.

And yes, that’s the 80% that’s probably going to be hit hardest by Coronavirus, and climate change.

So if we are going to start flying at pre-crisis levels at some point, we’ve got to have a real plan for how to do so without adding carbon into our dangerously saturated atmosphere.

Coronavirus has reminded us it’s a good idea to listen to the science. To maintain a safe climate for human habitation, scientists say the world must have abandoned the use of fossil fuels by 2050 or before. Some parts of this transition to low carbon energy have an obvious route. For example, we know how to get to zero emissions from electricity production and road transport. 

But what about flying? This month the largest yet electric plane made a successful half-hour flight - but it was still tiny, with room for nine passengers only.  Longer flights, carrying hundreds of people, will need to be powered by energy-dense liquid fuels for decades to come. 

Investment in zero-carbon aviation fuels then, is the most important measure of much airlines care about climate change, and on that measure, during the last 10 profitable years for the airline sector, the answer is - almost zero. Now that airlines are in crisis, and receiving huge sums of public money, it’s time to fundamentally rethink the business model. Building a new industrial sector around zero-carbon aviation fuels is an obvious target for a green stimulus.

The development of climate-safe aviation fuel is undoubtedly a challenge. Nevertheless, it is technically feasible and well within the competence of the UK’s universities, our innovative young companies and chemical engineering industries.

Research work at the moment focuses on making fuel from wastes such as plastics or wood chippings. This route is a dead end, because thevolumes of aviation fuel required around the world (around 7 million barrels per day, pre-crisis) dwarf any available source of waste. 

A different route is necessary, making carbon-neutral fuel in a anindustrial process that does not require use of scarce materials. Is this even possible? Surprisingly, yes, it’s been done already. We can make chemically equivalent versions of jet fuel by combining hydrogen produced from water via a process called electrolysis, and carbon dioxide captured from the air or from industrial processes such as cement making. If the hydrogen is made using renewable electricity, and the CO2 is sucked from the atmosphere, this synthetic aviation fuel adds no carbon to the atmosphere, and is compatible with the UK’s ‘net zero’ target.

This is not speculative science on a blackboard. The reaction of hydrogen and carbon atoms to make complex hydrocarbons occurs in a process called “Fischer-Tropsch”, that was invented in Germany almost a hundred years ago. We are able to employ well understood rules of chemicals production to make hydrocarbons that are almost exactly the same as those made from fossil oil.  In fact, they will be better because they contain no sulphur or any of the other unwanted materials contained in fossil fuels, and will cause far less pollution from ultra-fine particles.

So we’re not “waiting for a breakthrough” - we face a large engineering project. Decarbonising aviation requires mass manufacturing of hydrogen using electricity generated from renewable sources, the capture of carbon dioxide at the lowest cost, and the building of large Fischer-Tropsch refineries that can produce millions of tonnes of fuels a year. Although small groups of companies in Germanythe Netherlands and elsewhere have begun to develop integrated plants that can make this carbon-neutral synthetic aviation fuel, the field is still wide open for the UK to dominate.

At present, synthetic fuels are more expensive that fossil equivalents. One estimate is that the cost is equivalent to oil at $100 a barrel, even in regions where cheap hydrogen can be made.[1] However the only way to bring these costs down sharply is to scale up production. The UK’s task is to establish a synthetic fuels industry to capitalise on what will become a multi-billion dollar global industry. ITM Power, a Sheffield company, is already a world-leader in making hydrogen from renewable electricity. Several UK businesses, such as C Capture in Leeds, have expertise in CO2 collection. 

What policies do we need to push the development of carbon-neutral aviation fuels? I suggest four: tax, regulation, subsidy of the first commercial plants and new research. Firstly, fossil jet fuel is currently free of any tax and the first change should be a levy that pushes its cost per litre at least up to the level of petrol. (There are barriers in international treaties but the global interest in imposing fair taxation on aviation is probably at an all-time high). Secondly, regulation to mandate the airlines use a small but growing percentage of zero carbon fuel, copying Sweden and Norway.. The immediate boost to the UK synthetic fuel industry would be enormous. 

Thirdly on subsidies, use some of the revenue from taxing fossil jet fuel to run competitions to develop commercial-scale Fischer-Tropsch refineries that use zero-carbon hydrogen and captured CO2. The industrial infrastructure is there to build these refineries today, and sufficient government support will rapidly bring low-carbon aviation fuel to market. Importantly, the scale of the eventual market for low carbon fuels would mean that the oil majors would pitch for these funds. It gives them a route away from fossil fuels. Lastly, it makes sense to direct research funding towards this sector, particularly because it fits the UK’s existing skills in chemical engineering.

It’s not going to be easy. But the world has no alternative to synthetic fuels if we want to continue to be able to fly. The UK’s green stimulus should include all four of the above measures, to speed up the development of this potentially vast new industry. 

Chris Goodall’s new book is called What We Need To Now – For a Zero Carbon Future


[1]


'Renewables plus hydrogen' - almost all that we need

The world’s entire energy system is going to be built around renewable electricity and green hydrogen. This was an unconventional assertion to make as little as six months ago. In some parts of the world it is now perceived to be a statement of the obvious. 

The purpose of this note is to provide basic details of the major large-scale experiments and commercial projects in Europe and elsewhere that demonstrate that hydrogen can fully complement green electricity and will provide the energy source for almost all activities that cannot be electrified. I write because I think that the development of a ‘renewables plus hydrogen’ economy should be the policy priority for the UK and other countries.

Renewable electricity

 Electricity will become the power source for almost all surface transport, including buses and many heavy vehicles. Electricity will provide increasing percentages of the low temperature heat that we need, principally through the use of heat pumps in homes and offices. 

I propose in What We Need To Do Now that we deal with the problem of intermittency of most renewable source of electricity by massively expanding our capacity to collect energy from the wind and the sun. This will give us sufficient electricity almost all of the time, reducing to almost zero our need for backup sources of power. 

Most of the time our electricity system will have major surpluses. These surpluses will be converted into hydrogen, perhaps accompanied by batteries for storing daily surpluses of solar electricity. This large volume of hydrogen (perhaps as much as 1,000 terawatt hours in energy value for the UK, or 3 times our current power consumption) should be productively employed to provides the energy for almost all other activities in the economy.  The best use is to employ it to make hydrogen, via the simple process of electrolysis of water.

A list of the other many potential uses of hydrogen follows, alongside the brief statement of recent large scale trials that have been announced.

Hydrogen uses

1, Hydrogen as a source of energy for generating electricity

On the rare occasions when renewable electricity plants are not providing enough electricity, hydrogen can be used as a zero carbon fuel to generate electricity. This can either be done through the use of fuel cells or by employing turbines modified to burn hydrogen. 

 The hydrogen will have been initially made by water electrolysis and probably stored in underground salt caverns or disused oil or gas fields. The process of making hydrogen from electricity and then converting it back to electricity when needed is called ‘PowerToGasToPower’ (P2G2P).

Key experiments: In southwest France, paper company Smurfit Kappa operates a paper mill. The 12 megawatt power and heat needs for this mill are provided by a Siemens turbine that currently runs on natural gas. A project announced in May 2020 will see the existing turbine repurposed to run on hydrogen. When electricity is in good supply, an electrolyser will produce the hydrogen, which will be stored on site. The hydrogen will be used when power is scarce, or the price high. By 2023, this €15m scheme should be able to demonstrate flexible operation that allows the turbine to be run on up to 100% hydrogen. 

On Orkney, a chain of islands off north eastern Scotland, hydrogen produced at a wind farm is transported by sea to the main port where it is used in a fuel cell to create power to operate dockside equipment. This trial was one of the first P2G2P experiments in the world.

2, Hydrogen provides the fuel for building heating systems

 Scottish Gas Networks, which manages gas distribution across Scotland and parts of England, announced a plan to shift 300 homes in the Levenmouth area in eastern Scotland from natural gas to hydrogen, starting in 2021. The hydrogen will be made using electricity from an offshore wind turbine. . Individual homes can be converted using a replacement of the central heating boiler with a hydrogen equivalent. Worcester Bosch, the UK’s largest supplier of domestic boilers has produced hydrogen equivalents that are similar in cost to standard devices. 


In the Netherlands, a house refurbishment was completed last year that includes a hydrogen central heating boiler, powered by an electrolyser that gets its electricity from solar panels on the roof. The hydrogen is stored in a small container in the garden of the house. 

A small number of other places around Europe are operating gas networks with 20% hydrogen added. One example is the network around Keele University in the UK. SNAM, the main Italian gas company, is similarly running experiments that gradually increase the percentage of hydrogen in natural gas piped to two factories near Naples.

3, Running road vehicles

Electricity stored in the car’s batteries will probably be the power source for almost all domestic and light commercial vehicle use. But some car companies still believe it will be possible to use fuel cells instead, even though they are currently much more expensive to build. 

Hydrogen is stored in the car and is fed into the fuel cell. Electricity is generated which then powers the car’s electric motors. This can provide much longer range than most pure electric cars. Germany, for example, now has about 100 hydrogen refuelling points. This enables a hydrogen car to be driven with security around the entire country.

The highly-rated US commercial vehicle startup Nikola will launch a pickup truck that can either be powered by batteries or by a hydrogen fuel cell. The fuel cell version will have a claimed range of 600 miles. Launch will be in 2022, but the company’s larger full sized truck will be available in late 2021 fuelled by hydrogen.

Because they can be powered by hydrogen or batteries, road vehicles are entirely compatible with a ‘renewables+hydrogen’ future.

4, Trains and ships

The French manufacturer Alstom has launched a train that runs on hydrogen. It has operated successfully on a line in northern Germany and will also be trialled in Italy and the UK.  

Ships that travel regularly between islands or across fjords can be easily switched to electric power. Over 100 battery powered ships are at work around the world. Longer distance shipping cannot be fully electrified because of limitations on battery capacity. The industry is actively debating whether the future is based around ammonia (which is made from hydrogen) or hydrogen itself. 

A new Norwegian cruise ship will be powered by hydrogen (and batteries) when it is launched in 2023. . Norway is the leader in moving to hydrogen for ships alongside France. Hydrogène de France is working with Swiss engineer ABB to build large-scale hydrogen fuel cells for international shipping. 

A recent study concluded that almost all cross-Pacific shipping could be switched to hydrogen without difficulty.

5, Aviation fuel

 Although very short distance flights may be possible in battery-powered planes, the large bulk of greenhouse gas emissions arise from longer journeys. 80% of emissions come from journeys over 1,500 km, The alternatives are hydrogen fuel cells for smaller planes and low-carbon replacements for conventional fuels for larger aircraft. These two routes will be vital if we are to avoid greenhouse gas emissions from aviation making the achievement of ‘net zero’ impossible

ZeroAvia makes an airplane for 10-20 passengers that uses hydrogen in a fuel cell as the power source. It plans to start a service between Edinburgh and Orkney, off the north-east coast of Scotland. 

Larger airplanes will use synthetic kerosene, almost certainly made from hydrogen and carbon dioxide. Although some waste materials can be gasified and turned into fuel, the large volumes of aviation kerosene required around the world probably mean that most will be made from hydrogen coming from water electrolysis.

Two projects have been recently announced that seek to make ‘drop-in’ replacements for today’s fuel. In Norway, Climeworks and Sunfire have joined local partners to build a plant that makes aviation kerosene from air-captured carbon dioxide and hydrogen made from renewable electricity. By the end of 2023, Norsk eFuel targets output of enough synthetic fuel to cover 50% of the needs of the busiest 5 Norwegian internal flights. The venture then aims to make 100 million litres of fuel a year by 2026 in a ten times expansion of its pilot plant.

A similar new enterprise in Denmark seeks to replace 30% of the aviation fuels used at Copenhagen airport by 2030. The business is operated by a consortium that includes Maersk, the world’s largest shipping company, and Orsted, the offshore wind operator.

6, Steel

At present, new steel is made in blast furnaces in which coal is used to heat iron ore. The carbon from the burning coal merges with the oxygen in the ore, leaving liquid metal, which flows out of the furnace. This process, and the associated manufacturing activities, may be reasonable for as much 7% of global emissions.

Steel can be made using hydrogen instead of coal. Burning hydrogen can capture the oxygen in iron ore in an analogous way to coal. The furnaces are different but the outcomes are similar. A good description of how the hydrogen production compares to coal is given here.

Several steelmakers have announced plans for switching to hydrogen. Among the most advanced is the large speciality steelmaker SSAB which makes steel in Sweden and Finland. SSAB is building a trial furnace running entirely on hydrogen made with renewable energy. The company says that it will have commercial carbon-free steel available by 2026 and all its steel production will be completely zero-carbon by 2045.

In June 2020, German steelmaker Thyssen Krupp announced a move towards hydrogen. It will buy renewable hydrogen from the utility RWE for use in a blast furnace at its plant in Duisburg. A 100 MW electrolyser will make sufficient hydrogen to produce about 50,000 tonnes of carbon-free steel. Thyssen Krupp makes about 8 million tonnes of steel a year or 160 times as much but this is a first step towards entirely carbon-free steel production by 2050.

7, Fertiliser production

The Norwegian fertiliser giant Yara is heavily involved in trials of making the hydrogen for fertiliser production from renewable electricity. It will supply part of the part of the hydrogen need for its Porsgrunn plant in Norway from a 5 MW electrolyser. 


It is investigating a much larger trial at its plant in Pilbara, Western Australia. Here it hopes to integrate green hydrogen made by a subsidiary of the French energy giant Engie into its existing production process.

8, Oil refineries

Oil refineries use almost half the total amount of hydrogen produced today. Almost all is generated from fossil fuels, principally natural gas. Several refineries are investigating switching to hydrogen from renewable electricity. On the east coast of England, for example, Danish offshore wind company Orsted is planning to bring power onshore from the Hornsea 2 farm and put into an electrolyser. The hydrogen will be then piped to the Immingham oil refinery. 

In the Netherlands, a similar scheme will feed Europe’s large oil refinery at Pernis near Rotterdam owned by Shell. Offshore wind power will be used to make hydrogen which will be used in the refinery’s operations

 Any output of a conventional oil refinery is, of course, not zero carbon. But making hydrogen from renewables will reduce the net climate impact of using fossil fuels. In the long term, the world will still need refineries to make materials such as plastics from synthetic fuels made from hydrogen and sources of carbon. 

Conclusion

What CO2 generating activities cannot be switched either to electricity or to hydrogen? The list is very short. The most important industry is probably cement making. Heat is needed to drive off the carbon dioxide from calcium carbonate and this can be provided by hydrogen rather than coal. But the chemical reaction in the process must inevitably produce CO2. This CO2 is gradually recaptured by concrete or other uses of cement but this reaction is quite slow. (Innovative technologies, such as that used by CarbonCure can incorporate CO2 into drying concrete at a much faster rate). 

Otherwise electricity or hydrogen can cover almost all our energy needs. Other greenhouse gases will be produced from activities outside the energy system, of which agriculture is the most important culprit. However the central fact is that nearly complete decarbonisation of the energy system is possible using renewable electricity and hydrogen. As renewables become cheaper and cheaper around the world, also pulling down the price of making hydrogen, this decarbonisation will involve only small and temporary cost increases for energy. In the medium term, ‘renewables plus hydrogen’ will be cheaper than any other sources.

 June 17 2020

Public Opinion Strongly Favours Renewables, Including in the Local Area

Calls are growing around the world for expansion of renewable power as part of the route out of economic depression. Alongside a submission from a wide array of British business leaders, Greenpeace UK added to the calls overnight. Justin Rowlatt, the BBC’s environment correspondent, responded with some scepticism this morning (4th June 2020)

He wrote:

(M)any local communities are likely to resist the plan for a big increase in onshore wind and solar power to complement a proposed massive expansion of offshore wind farms - few things unite local communities like a proposal to put in an array of wind turbines.

The evidence to back this is non-existent. British people overwhelmingly back local renewables, particularly if ownership is also localised.

Here is the evidence from the latest BEIS (the UK government’s department for industry) survey.

Renewable opinions mar 2020.jpg

Source: https://www.gov.uk/government/statistics/beis-public-attitudes-tracker-wave-33

Negative emissions: how one US business bought $1m of CO2 storage

The world will find it difficult to completely eradicate fossil fuel use. By 2050 some sources see a minimum of 5 billion tonnes of CO2 emissions, down from about 50-55 billion tonnes today. We therefore need to develop a series of technologies for capturing carbon dioxide and permanently storing it in order to achieve ‘net zero’. 

Several industries, such as oil extraction, find it difficult to envisage how they might completely abandon their core activity. They have usually suggested, often in the vaguest possible terms, that they could offset the remaining emissions by planting woodland. As it grows, a tree takes in CO2, although this will gradually return to the atmosphere after it dies. Even rapid reforestation across millions of square kilometres is unlikely to fully compensate for the greenhouse gases produced by burning oil. The world needs a much wider variety of different carbon capture technologies.

Stripe and the CO2 capture challenge

 Stripe is a payments processing business based in San Francisco. Valued at tens of billions of dollars, it is a world leader in providing robust systems for handling the transfer of money and financial obligations. 

In the autumn of last year, it asked for bids from entities offering robust greenhouse gas collection and storage. Stripe said it would pay a total of $1m to the best schemes. It got responses from 24 different companies and research teams around the world and awarded four a quarter each of the funding on offer. May 2020 saw the award of the cash.

These 24 offers illustrate the wide range of possible negative emissions technologies. In an extremely helpful move, Stripe published details of each bid. (See ‘Source Materials here . I split them into ten different categories. 

Type of CO2 capture and/or storage + brief description 

Soil carbon improvement (4 bids)

Global soil contains about 1.5 trillion tonnes of carbon, far more than is present in vegetation. Modern agriculture and deforestation is tending to reduce the carbon content of soil. Measures to regenerate carbon in soil can result in very long term carbon capture.

 Bio-energy with carbon capture and storage (BECCS) (1 bid)

Wood and other organic matter captures CO2 as part of the photosynthetic growth process. If the material is then burnt, perhaps to generate electricity, and the the resulting CO2 is then captured and stored, the lifecycle results in negative emissions.

 Woodland Maintenance (2 bids)

Keeping a wood that would otherwise be cut down will, in effect, store carbon.

Reforestation (2 bids)

Putting forests back in areas where they have been lost.

Afforestation (2 bids)

Creating forests in places that currently do not carry trees.

 Olivine weathering (2 bids)

Olivine is a rock that naturally absorbs CO2. Large volumes exist and it can be ground into small specks to speed up the permanent capture of carbon.

CO2 capture in building materials (5 bids)

Several building materials either naturally retain CO2 (such as structural bamboo) or can be altered to permanently capture more of it (such as concrete)

 Direct Air Capture of CO2 (1 bid)

Although CO2 is only a tiny fraction of the world’s atmosphere, it can be separate out and then stored. 

Biochar/Bio-oil (4 bids)

Heating organic material to high temperatures in the absence of air will break it down into gases, oil and nearly pure carbon. The oil and the carbon can be stored permanently in the top soil or deeper.

 Ocean storage (1 bid)

The bidder proposed to bring up water from the deep ocean to the surface. Plankton growth will be encouraged (which absorbs carbon from the sea water) and then the water will be returned to the deep. There, the plankton will die and store the carbon on the ocean floor. 

The winning bids were from the Olivine, CO2 capture in building materials, Direct Air Capture and Biochar/Bio-oil sectors. No money was awarded to forestry or soil carbon offerings, even though some of these bids were substantially cheaper than the winners in terms of cost per tonne of CO2.

The winners

Climeworks, the Swiss company which has done the most to bring Direct Air Capture into consideration, runs a plant in Iceland which captures CO2 from the air and then injects into deep basalt, permanently absorbing it. Its technology is currently expensive and it will be paid over $700 a tonne for just 322 tonnes of collection and storage. Climeworks says that the potential of its technology for storing CO2 is almost limitless.

Canadian company CarbonCure has a technology for injecting CO2 into concrete before it sets. The carbon dioxide is permanently stored and actually makes the concrete stronger. Carbon Cure estimates a worldwide potential for its group of technologies of about 500 million tonnes a year, about 1% of world greenhouse gas emissions. The company asked for $100 a tonne and agreed to absorb 2,500 tonnes.

Project Vesta will grind up olivine and leave the sand on beaches where it will be weathered by the CO2 in the air. Its says its approach is cheap, requiring a payment from Stripe of only $50 a tonne today. Project Vesta says that olivine weathering could permanently store tens of gigatonnes of CO2 per year since the rock exists in large quantities around the world. 

Charm Industrial takes waste biomass, such as shells from farmed nuts, and puts it through a pyrolysis process. A carbon-rich oil is one of the outputs. This can be injected into depleted oil wells where it will be permanently stored. This is currently an expensive process and the company offered to sequester CO2 at $600 a tonne. Charm Industrial claims that its process might be able to store 7 billion tonnes of CO2 in 20 years. However it is still at an early stage in its development.

The bidding process bought Stripe just over 6,500 tonnes of negative emissions at an average price of about $150 a tonne. All four seem very convincing processes. I was slightly surprised to see that all the projects backed by Puro, a highly plausible Finnish operator of an auction system for CO2 storage, failed to get backing from Stripe.

How much will carbon capture and storage cost? 

The simple average of the 24 bids to Stripe was $177 per tonne. Participants generally expect very significant reductions in cost, projecting a figure of just $37 a tonne in 20 years time (Simple average). Let’s put these numbers into context.

 $177 a tonne – total cost to neutralise 50 billion tonnes of 2020 emissions – about 9% of world GDP

$37 a tonne – total cost to neutralise 10 billion tonnes of 2040 emissions – about 0.4% of current world GDP

 Of course the 2040 numbers may be absurdly optimistic. Some - such as the $10 estimated by Project Vesta for olivine weathering - do look highly ambitious. But even at an average figure of $100 a tonne that I suspect may be more reasonable, the costs of storage of 20% of today’s emissions are only about 1% of the world’s economy. This is manageable. 

 What other lessons should we learn from the Stripe call for bids?

A promise of $1m of funding brought forward 24 bids, most of which seem potentially effective. We need other entities (companies, governments, charities, philanthropists) to go through the same process, encouraging and developing the nascent carbon storage industry. By the way, conventional CCS, particularly on power stations, looks far more expensive than the bids we have just seen.

My first guess is that regenerative agriculture needs active sponsorship to show whether, and at what rate and with what degree of permanence, it can add carbon to the soil. Slightly surprisingly, none of the four offers in this ‘auction’ won funding. I think a prize specifically for soil carbon storage would be particularly beneficial.

Many congratulations to Stripe on carrying out this vital and highly productive task.


'What We Need To Do Now': an inexpensive online edition and a chance for online discussions.

Books and ideas are the new currency in these lockdown times …

I’ve been approached by a couple of XR groups who have been setting up online reading groups and wanted to discuss the ideas in my book, What We Need To Do Now (for a zero carbon future).  This set my publisher, Profile Books, and me to thinking – how can we make this easy and inexpensive?  We have arranged to have a nominal price of 99p for the book if downloaded from Apple, and (currently) £1.61 if bought as Amazon Kindle. The Kindle price should drop to 99p, too, but it is controlled by Amazon so out of Profile’s hands.

What We Need To Do Now (for a zero carbon future) is what it says on the tin: a program for how the UK can reach zero carbon across every sector of the economy – not just electricity but housing and heating, transport, flights, fashion, heavy industries (notably concrete and steel), agriculture and food. My conclusions are that each area is challenging but possible. We need to build an over-capacity of wind and solar energy, storing the excess as hydrogen. We can then use hydrogen to fuel our trains, shipping, boilers and heavy industry, while electrifying buses, trucks and cars. We need to farm – and eat – differently, encouraging plant-based alternatives to meat, and paying farmers to plant and maintain woodlands. Fashion has to become sustainable and aviation must pay its way, funding synthetic fuels and CO2 removal. And we then still have some way to go, using technical solutions to capture CO2 from the air and biochar to lock carbon in the soil. To help the transition, we’ll need to tax carbon emissions in a fair and equitable way that doesn’t penalise the less well-off. We should begin a programme of research into ‘geoengineering’, particularly working on how we reduce the intensity of the sun’s energy reaching the earth.

My program may not be the definitive answer.  But I hope that anyone reading the book will feel it shows a possible pathway. And, of course, I’m eager to hear new ideas, which will be included in future editions of the book.

Please encourage your local groups – XR groups, for instance, or regular book groups – to take part and use the book. I am very happy to participate in any online discussions via Zoom.

Here are the links

Apple Bookstore for 99p and at Amazon Kindle for £1.61


The victory at Heathrow; just a first step

(This article was published in the Independent newspaper in early March)

The block to the expansion of Heathrow is an early victory in the fight against climate change. The third runway would have expanded the number of flights from the airport by over 40%.  If the decision is upheld by the Supreme Court, emissions from aviation will be lower than they otherwise would have been. 

But our celebrations should be muted. We still need to address the underlying problem. How does the UK achieve a target of zero emissions by 2050 while aviation remains such an important source of CO2? There is only one way forward: the UK needs to focus on making jet fuel from man-made sources that don’t add to carbon emissions.

 Flights from the UK add almost 40 million tonnes of CO2 to the atmosphere each year, around 7% of the national total. These numbers are particularly high by international standards. Another way of expressing the unusual importance of aviation to UK emissions is to note that more British people engage in international air travel than Americans or Chinese, even though those countries have vastly greater populations.

The carbon consequences of individual trips are severe. A return flight to New York adds over a tonne of CO2 to an individual’s carbon footprint, almost as much as the typical annual emissions from a small modern car. Moreover, that figure excludes the extra impacts of burning fossil fuels high up in the atmosphere, which scientists estimate may roughly double the overall greenhouse effect of flying.

Unfortunately, the energy for flying will need to come from liquid fuels into the foreseeable future. Batteries are too heavy to power any but the very shortest flights, such as between Scottish islands. Hydrogen, another alternative sometimes mentioned, cannot compete with the energy contained in an equivalent volume of aviation kerosene. ‘Flight shaming’ may reduce the number of people in the air, but even a halving of departures would still require the UK to shift 15% of its land area into forestry to fully offset the remaining emissions. 

However there is a route forward, although many technical and financial obstacles remain to its full implementation. We can chemically create man-made alternatives to fossil oil so that we can continue to fly without a net impact on emissions (although the extra effects of burning fuels at 35,000 feet will persist). 

Are man-made alternatives to aviation fuels really possible? Yes. The molecules contained in fuels such as aviation kerosene are composed of atoms of hydrogen and carbon (hence the expression ‘hydrocarbon’). If we have supplies of these two basic chemical elements we can use well-understood engineering techniques to create complex hydrocarbons that are full replacements for fossil fuels. The processes employed have been in active use for many decades and already make hundreds of millions of tonnes of useful chemicals each year.

The crucial question to answer is therefore this. How can we create abundant amounts of hydrogen and carbon in a way that doesn’t add greenhouse gases to the atmosphere, and at a reasonable price? Hydrogen is the simpler case. All we need is a supply of renewable electricity which we then use in a machine called an electrolyser. This uses the electric power to separate out the hydrogen and the oxygen in water molecules. The hydrogen can then be stored. 

Carbon is a little more difficult. The conventional source in today’s chemical processes is carbon monoxide, a molecule that is a mixture of one atom of carbon and one atom of oxygen. We can generate carbon monoxide very simply from carbon dioxide. 

In turn, our carbon dioxide can come from two main sources. We can burn natural materials such as wood, perhaps in a power station, and collect the CO2 that arises. Because the carbon in that wood had been originally collected from the atmosphere by the process of photosynthesis we can use it to make aviation fuel without any net consequences for greenhouse gas levels in the atmosphere. The problem is that we have restricted supplies of wood or other biological fuels to burn, particularly since we are trying to add forests to the world’s land surfaces.

Probably the best way of getting large quantities of carbon dioxide is to collect it directly from the air. This is possible, but the technology is still at an early (and expensive) stage. Once we have good supplies of CO2 and hydrogen we can manufacture abundant amounts of a fuel that will not result in net additions to greenhouse gases. 

We cannot completely avoid the need for flying, even though each of us has an obvious responsibility to avoid taking the plane when we can. Because of the particular importance of aviation to the UK economy, it now makes clear sense for the country to invest in the research and development to push synthetic fuels forward, probably using money raised from taxation on today’s ultra-polluting aviation.

 Chris Goodall


The road to ‘Net Zero’

(This article was published by BBC Focus on 14th February 2020).

Belatedly, the world has realised it has to eliminate greenhouse gases within a few decades. The UK has promised ‘net zero’ by 2050. Is this is an achievable aim? How much will it cost? In what ways will our lifestyles need to change?

In summary, the answer to these questions is that reducing carbon emissions sharply is feasible but the change will be expensive and requires hard adjustments to some aspects of our lives. It will be almost as disruptive as the first Industrial Revolution. But, at the end of the process of decarbonisation, we might reasonably expect to have built a far safer world and a society that is both more prosperous and more equal.

The UK needs to set out a programme of carbon-cutting actions across all parts of today’s society, starting with energy supply but spreading across activities as diverse as agriculture and clothing manufacture. Alongside the plan, the book also demonstrates how ‘net zero’ can be made politically attractive by improving the availability of decent jobs and by cutting the cost of living. 

Many people assume that this country is already well on the route to zero emissions. But the sharp reductions in greenhouse gases that the UK has achieved thus far have almost entirely come from improving electricity supply by switching out of coal and increasing wind and solar power. This was the easy bit. The challenge now gets far more difficult because we still use carbon-based fuels for about half our electricity supply as well as almost all our other energy needs. 

We can, of course, increase our low-carbon energy sources by installing more wind farms, on- and off-shore, and by welcoming more solar parks around the country. But, as sceptics are fond of pointing out, the cheapest renewable energy sources do not always provide electricity when we need it. The sun doesn’t shine at night and we can have weeks of low winds around the British Isles. 

A clear proposal is that we hugely expand our renewable installations - perhaps twenty fold -  so that almost all the time we have enough electricity to match demand. This will be the case even after we have switched as many energy uses as we conceivably can from fossil fuels to electric power, such as by driving battery cars and powering many of our homes with heat pumps.  

Oversupplying the UK with renewable power means that most of the time we have too much electricity. Isn’t this wasteful? No, we can use this surplus to generate hydrogen - the key low carbon energy source - by electrolysis. Large numbers of major experiments around the rest of Europe are now looking at using hydrogen to help balance the electricity system. The UK should do likewise but, with the exception of real development on Orkney, interest is limited. Hydrogen stored in depleted oil fields or in underground salt caverns can be used to generating electricity when the wind isn’t blowing either using rapidly improving fuel cells or even modified gas turbines. We can also replace natural gas for domestic use with central heating boilers that burn hydrogen instead. 

Over the course of the year we will still have too much hydrogen for our electricity needs. The second use of the surplus will be to provide energy for all the activities we cannot electrify. This will include almost all aviation, long distance shipping and some heavy industrial processes. We can use standard chemical engineering processes to create synthetic alternatives to conventional oil and gas. 

Fossil fuels are largely composed of atoms of hydrogen and carbon (hence the name ‘hydrocarbons’). We know from where we are going to get our hydrogen for our alternatives to fossil fuels.  Our carbon will come from capturing CO2, either directly from the air or from industrial processes such as cement manufacture. although not yet cost competitive in most circumstances. If we then burn the synthetic hydrocarbons as fuel, the CO2 will return to the atmosphere so the UK will also need to invest in long-term storage for further carbon capture. 

We therefore have a well-defined route to ‘net zero’ when it comes to energy supply. But this only covers about two thirds of all emissions. The next most important source of greenhouse gases is agriculture, either in the UK or arising from the growing of foodstuffs that are imported. As is becoming increasingly well understood, cattle farming is a particularly important source of methane which, like CO2, helps heat the global atmosphere. Perhaps 10% of all greenhouse gases arise from cows and other ruminants. Other animals are less bad but are still significant contributors to the climate change problem. It is very uncomfortable to say this but climate stability is impossible to reconcile with today’s levels of meat-eating. 

The world’s diet needs to shift towards plant-based foods. Grains, pulses, seeds and vegetables use far less land than meat animals, allowing us to reforest a substantial fraction of the world’s surface. As an aside, global food production is currently about 6,000 calories per person per day. So there’s no shortage of food; it’s just that most of it is fed to animals. And, of course, a varied diet that avoids farmed meat is likely to improve human health in rich countries such as the UK. Artificial meats and new forms of indoor agriculture will help us reduce the area of land we require.

We will also need to create an agricultural system that helps rebuild the depleted levels of carbon in our soils. This means moving away from our destructive emphasis on intensive monocultures and recreating an agriculture that improves local ecologies. As with many recommendations in the book, this change will be highly disruptive and farmers will need to be properly protected. 

What else else do we need to do? The next most important sources of emissions are steel-making, cement and fertiliser production. In each case, we can use some of the renewable hydrogen that we generated from surplus electricity production. Steel-makers around Europe, all aware that the coal used in making new metal is having destructive effects on the environment, are committed to using hydrogen for their energy source as soon as possible. Cement is somewhat more difficult but fertiliser production can shift very easily to renewable hydrogen. 

 Alongside the proposals for the reduction in carbon emissions, we need to examine how the UK can increase the capture of CO2 from the atmosphere. Building a restorative agriculture is one step but needs to be accompanied by a programme of reforestation. The UK is the least wooded major country in Europe and we can comfortably double or triple the land area given over to forests. This will help build a natural sink for carbon worth many tens of millions of tonnes of CO2 per year. It will also help us decrease the £8bn or so that is spent each year on imports of wood products and provide an important source of jobs in rural areas. 

What about energy efficiency? The single most important need is for the UK is to improve its almost medieval standards of home insulation. Existing programmes have failed dismally but new approaches towards complete or ‘deep’ refurbishment of houses show enormous promise, though they are likely to be expensive. The scope for high quality job creation is obvious. 

 Other steps we will all need to take include a move away from flying, better public transport and the creation of large car-free areas across towns and cities to encourage cycling and walking, while reducing the need to own a car. We’ll want to reduce our purchase of clothes, a major current of emissions and environmental degradation, as well as making sure that we create a fully ‘circular’ economy that recycles and reuses everything we need. 

 There’s no denying the painful nature of many of the changes we need to make to get to zero carbon. It would be nice to pretend that we could continue with minor measures such as banning plastic bags or turning the lights off. Unfortunately, the reality is that we will need to spend at least ten per cent of our national income for the next twenty years on investments to secure a liveable future. The good thing is that the UK - and the rest of the world - has the spare capital to invest on the scale that we require. 

 And at the end of the process we will have low energy costs, more comfortable housing, better public health, more nutritious food and more jobs embedded in the less prosperous parts of the UK. Put like that, I don’t think we should be too frightened of the challenge.

The extra costs of decarbonised steel

Under current conditions, and Swedish electricity prices, using hydrogen rather than coal will add about 10% to the cost of a tonne of unfinished steel before considering extra capital costs. A carbon tax of about €30 a tonne would bring the energy cost of steel made from coal up to the hydrogen price.

The SSAB pilot plant under construction

The SSAB pilot plant under construction

As wholesale electricity prices fall, hydrogen will become progressively more financially attractive and Swedish manufacturer SSAB is targeting 2025 for the first large scale sales of decarbonised steel. Although hydrogen-based steel making also involves high levels of capital expenditure, SSAB says it is a ‘commercially attractive option’.

 Steel manufacture

Almost all new steel is made from iron generated in blast furnaces. Recycled steel is made in electric arc furnaces. 

The process for making new steel feeds coke and pulverised coal into the furnace alongside iron oxides that are in the form of pellets or raw ore. In intense heat the coke, which is almost pure carbon, reacts with the oxygen in the iron oxides and forms carbon monoxide and carbon dioxide. The resulting metal, often called pig iron, is fed into another furnace which purifies the iron and adds carbon and metals to form steel.

The making of new steel from iron ore adds about 2 tonnes of CO2 to the atmosphere for each tonne produced. Approximately 1,200 million tonnes of new steel are made each year, meaning that around 2.4 billion tonnes of greenhouse gases are added to the atmosphere, or about 6% of the global total. Other elements of the steel production process, and the operation of electric arc furnaces, add 1 or 2% to this total. The amount of new and recycled steel produced will rise over the next decades, increasing emissions.

So steel matters. Specialists say that the production of the metal can be decarbonised in three different ways. 

·      Carbon dioxide coming out of the blast furnace can be collected and stored, or turned into useful hydrocarbons

·      Coal can be replaced with biomass. 

·      The production technology can be changed and hydrogen can then be used to strip the oxygen from the iron ore. The hydrogen will come from the electrolysis of water using renewable electricity.

 Many of the major steel manufacturers in Europe have indicated that they will move towards using hydrogen as the route to low carbon steel. Chinese manufacturers, representing approximately 50% of world production, have been more interested in carbon capture and reuse. 

The hydrogen route will require the decommissioning of existing blast furnaces and their replacement by what are called ‘direct reduction’ furnaces. The pig iron that is created by direct reduction can then be converted to steel in an electric arc furnace.

This article looks at some the possible costs of the switch to hydrogen. The figures are far from definitive because so little information is currently available, largely because no individual steelmaker has yet gone beyond early experiments with one or two parts of the complicated set of process to make the metal.

Making new steel using hydrogen

Swedish steelmaker SSAB provided some analysis in a December 2019 investor presentation that showed how much extra cost the switch to hydrogen will add (Slide 28). SSAB is probably the steel manufacturing company with the most advanced plans for the switch away from coal. It targets total carbon neutrality by 2045.

In its presentation, the company contrasted the energy requirements of the current steelmaking process and compared it to the hydrogen route. I have calculated the costs that result from both production processes.

 Current blast furnace requirements (all costs are approximate)

 Oil – 81 kWh. Cost approximately €4. (Assumption: 8 litres of oil at a price of around $0.5/litre)

Coal – 5,510 kWh. Cost approximately €96. (Assumption: coking coal of 24 MJ/kg at $130/tonne, $1.10=1€)

Electricity – 235 kWh. Cost approximately $11 (Assumption NordPool price of €45/MWh)

Total energy and reducing agent cost per tonne steel = €111.

Hydrogen direct reduction route (all costs are approximate)

Graphite - 45 kWh. Cost €6. (Graphite, small flakes, $550 a tonne, energy value 32.8 MJ/kg)

Biomass fuel – 560 kWh. Cost €5 (Same price as low carbon content coal)

Electricity – 3,488 kWh. Cost €157. Assumption (NordPool price of €45/MWh)

Total energy and reducing cost per tonne steel = approximately €168


These numbers suggest that steel made from hydrogen in Sweden will have an energy cost of about €57 per tonne more than conventional processes. What does this number imply?

 ·      €57 is approximately 10% of the cost of a tonne of unfinished steel. In other words, the switch to hydrogen will add a significant, but not overwhelming increment.

·      The production of a tonne of new steel in the average world steelworks adds about 2 tonnes of CO2 to the atmosphere. According to SSAB, the hydrogen route produces about 25 kilos, a negligible amount. A carbon tax of €30 a tonne (about £26/$33) will therefore approximately equalise the energy cost of steel from coal and steel from hydrogen in Sweden.

·      Sweden has low wholesale electricity prices, and would have little difficulty coping with the extra demand for electricity for making steel. However a steel manufacturer paying €65, a more typical European price, would see a rise in energy costs of €70, enough to increase the required level of carbon tax to €65 (about £55/$71) per tonne. On the other hand, an electricity price of €30 per megawatt hour, no longer an impossible ambition, would roughly equalise the energy costs of the hydrogen and coal routes for steelmaking.

·      As an aside, the total demand from hydrogen steel production by SSAB in Europe would add about 21 TWh to electricity requirements. This is about 17% of today’s electricity use in Sweden. (However some SSAB steel is made in Finland). Separately, an estimate from the German steel industry suggests that a hydrogen-based steel production process will add 130 TWh, or over 20%, to national demand.

However the difference between the two technologies is not just the different material that is used to capture the oxygen in the iron ore. A steelmaker switching to hydrogen will require new capacity in the form of direct reduction furnaces, and possibly new electric arc furnaces as well. 

How expensive will this equipment be? No definitive figures are available, but German steel maker ThyssenKrupp indicates that the total cost is expected to be about €10bn for its 13 million tonnes of steel production. This implies a figure of about €770m capital investment per million tonnes of steel, or around €1 trillion over the course of the entire transition. SSAB in Sweden and Finland makes about 6m tonnes currently in new steel each year, implying a total conversion cost of about €4.6 billion, spread over 25 years to 2045, or about €185m a year. 

Is this expenditure conceivable? SSAB is a profitable company, partly because it has concentrated on especially high strength alloys, which command a premium price. Its operating cash flow in the last annual report was about €560m, suggesting that the cost of the hydrogen conversion is manageable. SSAB’s current projections indicate capital investment in its existing business of around €280 million, meaning that the switch may eventually reduce investment needs as the transition to hydrogen moves to completion after 2035. (However SSAB does indicate the capital investment in early years will add to the costs of making steel).

Other manufacturers around the world will examine different routes to carbon neutrality by 2050. However SSAB seems to have the most advanced plans and has decided definitively to go the hydrogen route, delivering the first commercial zero carbon steel in 2025. Technological uncertainties remain but most people in the industry, at least in Europe, seem to believe the switch away from coal is feasible.  The numbers in this note suggest that falling wholesale prices may bring hydrogen steel down to existing coal-based costs in countries with low electricity prices.


What happened to Repsol's share price after it announced a commitment to full decarbonisation?

Repsol, the international oil company headquartered in Spain, announced at 18.00 on 2nd December that it would target zero net emissions from its operations and from the burning of its fuels by 2050. It was the first large oil company to do this.

How did the stock market react? I looked at its share performance in the following four days and compared it to the nine other oil and gas companies that it measures itself against. (See https://www.repsol.com/en/shareholders-and-investors/repsol-on-the-stock-exchange/share-price/index.cshtml)

Presentation2.jpg

In the four days after the announcement, Repsol’s share price gained 3.5%. The best other performance was a rise of 2.2% for Italy’s ENI. The average for all the other nine companies was a rise of 0.3%. BP and Shell lost more than 1% each.

This seems to me to be an extremely powerful signal that investors are happy with Repsol’s new stance. And since all quoted companies seek to improve their share price, we are now entitled to ask why the rest of the oil majors do not follow Repsol’s new strategy.

How fast do solar panels degrade? Evidence from a single house over 15 years

Summary

I have recorded the monthly output from the solar panels on our roof for the fifteen years since they were installed. The records show a very slight decline in the electricity produced of about 0.05% each year. This translates into a fall of just over three quarters of one percent from when the panels were new. A panel producing 100 kilowatt hours in 2005 would typically generate 99.2 kilowatt hours in 2020, if the year sees an average amount of solar radiation.

The rate of decline of the panel outputs has been slower than most forecasts of solar panel degradation. Why? It may be that these panels are sited in a relatively equable climate and therefore are not subject to thermal stresses, which can cause microscopic cracks in solar cells. 

Is there any other potential explanation? I investigated whether the intensity of the solar radiation reaching the panels has changed. This might be because of the changing climate, or because of variations in local environmental pollution. I obtained a database of the number of hours of bright sunshine recorded in Oxford, at a point about 1 km from where I live. (Thank you to the Radcliffe Met Station). This dataset – which forms part of the longest-running climate record in the world – shows that Oxford is sunnier than it was. The number of hours of bright sun has risen by an average of almost 3 hours a year or about 0.18% per annum during the period in which the panels have been on the roof. (This continues an upswing since the start of the sun records in the database).  So although the solar panels may be degrading faster, the fall is disguised by the rise in bright sunshine. 

Using a very imperfect piece of statistical analysis, I estimated what the underlying rate of panel degradation is, adjusting for the disguise of increased hours of bright sun. This suggested a fall in performance of 0.17% per year, approximately the level one might expect for a very good set of panels. 

This means that the expected output of our panels over the course of the next year is approximately 2.6% less than it would have been when they were new, 15 years ago, if we take out the effect of increased sun. 

Since most financial models have a faster rate of decline, investment in PV in a temperate climate may perform better than expected. (Please note that the regression coefficients in this analysis are low, suggesting considerable statistical uncertainty).

Solar performance

Solar panels degrade slowly when in use. The rate varies partly dependent on the severity of the conditions the panels operate under. Very high temperatures or severe frosts will cause more rapid degradation, partly because thermal stresses induce microscopic cracks that disrupt electricity flows. 

Some manufacturers, such as Sunpower, make panels that will tend to decline in performance at a slower rate than those made more cheaply. 

Most large producers now offer panels with performance guarantees. The largest, Jinko, offers a warranty of 90% of rated performance after 12 years and 80% after 25 years. 

Our installation

15 years ago, PV panels were uncommon in the UK. Fewer than 5,000 domestic buildings had them on their roofs. We struggled to find an installer. Eventually we settled on a company about 150 kilometres away. 

The installer told us that to avoid shading we should only put 2 kilowatts on the roof. Similar houses to ours now can cope with 5 kilowatts because of the use of micro-inverters and higher power densities. (Maximum power output per square metre of panel). The house faces east/west, and we have 1 kilowatt of panels on each side. As a result of the orientation, power output in the winter is particularly low. The variation in monthly output between December and June is about ten fold, more than double that of a south facing site. 

Our 2 kilowatt of panels produced 1448 kilowatt hours last year. There have been no interruptions to the generation of electricity, with the exception of a two week period almost immediately after installation when one of the two inverters failed. In my calculations, I have estimated how much the inverter would have produced in that short break.

Generating record

I collect generating data each month. Sometimes I am away on the first day of the month and on my return I take the reading and estimate what the number would have been. Any small misestimates will, of course, wash out over the course of the year.

 Variations in monthly output change over the course of the year. The standard deviation of output in the summer months is 10% or less. This rises to up to 20% in winter.

The highest output in the December-November years in my record is 1494 kilowatt hours (year2) and the lowest is 1363 (year 13). This year (year 15) was slightly above the mean figure for the whole period of 1434 kilowatt hours.

In the chart below, I show the annual figure for each of the 15 years. A linear regression line shows an estimate of the trend rate of change. This line, calculated by Excel, suggests that the panels have declined from an expected production of 1440.8 kWh in year one to an expected figure of 1428.9 kWh in year 15. This is a 0.8% total change over the period and a yearly 0.05% reduction. 

Chart 1

Source: Personal records

Source: Personal records

Solar data

Two factors affect solar power output. The first, obviously, is the amount of sun. 

The second is temperature. High temperatures cause lower output. As expected, the best daily generation on our panels comes on cool days in late spring. I have not calculated the implicit reduction in performance that has arisen because the average temperature today is slightly higher than it was 15 years ago. The amount should be small since, as a rule of thumb, a panel’s performance falls off by about 0.5% for each degree of temperature rise. I haven’t checked the Oxford data but I assume the rise here in the last fifteen years was around 0.2 degrees, meaning a small 0.1% impact on annual output.

But what about sun, which is far more important? Is there pronounced annual variation in the amount of sun received in Oxford, the site of the panels? The Radcliffe Meteorological Station records a wide variety of weather variables including an estimate of ‘bright sunshine’. (I believe this term refers to whether the sun scorches a piece of paper if focused through a particular type of lens). These estimates go back to 1881. I am very grateful indeed to Thomas at the RMS for providing them so wonderfully efficiently. 

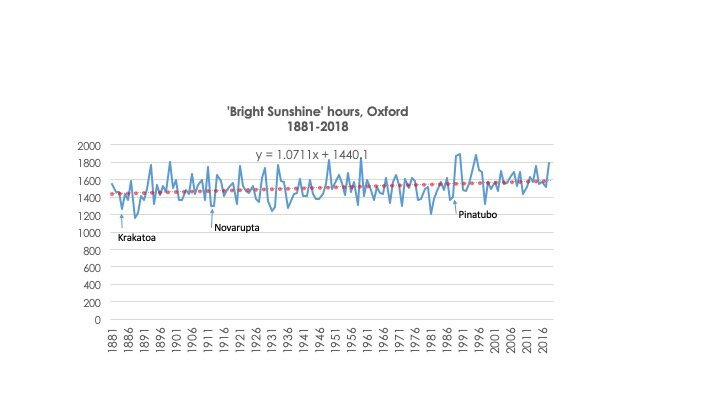
The figures show a rising trend in ‘bright sunshine’ over the nearly 140 year period. As an illustration of this, the mean duration of bright sun over the entire history is about 1515 hours per year but only three out of the last twenty years have seen figures lower than this. The average for the last twenty years is about 1600 hours. Typically Oxford has received slightly more than one hour more bright sun for each year that has passed. Those of us who live here haven’t noticed this, even though the increase has sped up in the last decades. 

(I never seen any reference to increasing sun hours in the UK in any other source. Is this is a general phenomenon, or specific to central Oxford, where there would have been more frequent fog in the past and possibly smoke from coal fires close to the observation site?).

The eruptions at Krakatoa, Novarupta and Pinatubo appear to cause major declines in the amount of bright sun, often for several years. This will have slightly suppressed the apparent rate of increase in the period up to late 2004 and therefore caused the apparent increase since then to be greater. (There have been no major eruptions in the last fifteen years).

The measure of ‘bright sun’ is an imprecise surrogate for the total amount of solar energy falling on a panel. PV doesn’t need strong sunlight to make electricity. Nevertheless, absence of cloud will result in a very much larger amount of generation so It is a reasonable proxy.

The chart below plots the number of hours of bright sun since 1881. A linear regression line from Excel is imposed, showing a typical increase over the near 140 year period of 1.07 hours per year. 

Chart 2

Source: Radcliffe Meteorological Station, re-used with permission

Source: Radcliffe Meteorological Station, re-used with permission

What about the last 15 years? Does the increase persist over this period? The data suggests it sped up. (Please don’t put too much weight on this, but the conclusion is striking). Since the solar panels were installed, the number of hours of bright sun has typically increased by 2.95 hours per year, almost three times the rate of the previous century or so. This is a rise of about 2.7% in total over the 15 years.

Chart 3

Source: Radcliffe Meteorological Station, re-used with permission

Source: Radcliffe Meteorological Station, re-used with permission

The implication of increased levels of bright sunshine is that any underlying decline in the efficiency of the solar panels will be disguised.

Adjusting the PV output data to reflect the increased sunshine

Taking into account the increased levels of sunshine, what is the underlying rate of degradation of the panels on our roof? A first estimate would be to simply deduct the percentage increase in solar hours (-2.7%) from the observed figures for output (-0.8%) over the 15 year period. This subtraction results in an estimated total fall of 3.6% (rounding) in underlying output, or about 0.24% a year. 

Increasing the complexity of the calculation

There are statistical problems with the estimate immediately above. The first of these issues is the seasonality of the distribution of increased sunshine. If, for example, most of the increase in sunshine hours occurs in winter, the impact on PV production will be much less evident than if the rise took place in the summer months. An hour of strong sun in December is occurring at a much lower angle than one in June, meaning the energy hitting the panels is less.

And this is indeed what happened. Of the 43 hours of annual bright sun increase between when the panels were installed and today, 28 occurred in the months of October to March. Only 15 were in summer. 

How do we adjust for this? It’s problematic, partly because our panels are facing east-west. This means that they are particularly poor at picking up the winter sun. We won’t have seen much of the benefit of increasing solar radiation in the October to March period. In fact, October-March actually saw a bigger percentage fall in our solar panel output than in the summer. The total decline in the winter months over the 15 years was 1.6% of average period output, compared to 0.6% in the summer. 

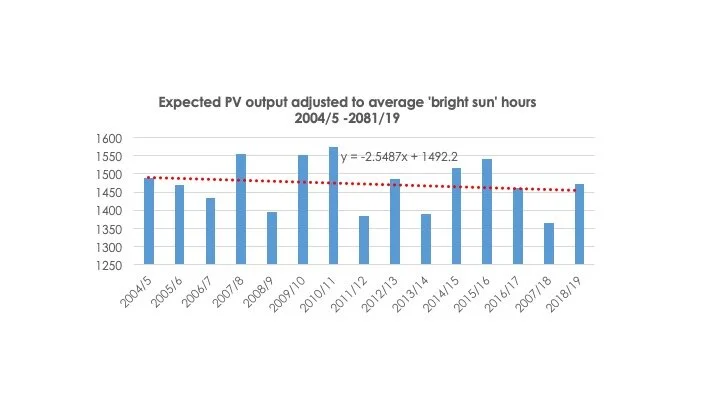
A more precise way of estimating the impact of the increase in sunshine is to look at the performance in individual months. For each of the last 180 months (15 years times 12 month) I adjusted the PV output by an amount that compensates for whether the bright sunshine in that month was above or below average for the fifteen year period. If, for example, the PV output was 100 kWh but the bright sunshine figure was 10% above average for that month then I deflated the 100 kWh figure by 10% to 90 kWh.

This is a statistically dodgy technique but I think it gives roughly correct results.* Plotting the result gives the chart below. It shows that, on average and after adjusting for bright sunshine, the average rate of underlying drop in performance is 0.17% per year.  This result is important because it suggests a better longevity of mono crystalline panels than usually predicted. Financial returns will therefore be better than expected.

Chart 4

Source: Personal records and data from Radcliffe Meteorological Station

Source: Personal records and data from Radcliffe Meteorological Station


* A statistical artefact means that the expected average annual PV output appears to be higher than it really is. I don’t think this affects the conclusions.

** The regression coefficients in this exercise are low. The results are therefore of dubious statistical significance. But they seem reasonable to me.


Reforestation is no substitute for emissions reduction

The last few months have seen a new tactic from the oil and gas industry. It has started to promise to offset carbon emissions by large reforestation programmes. In itself, this does no harm. But the world needs both to decarbonise energy supply AND massive reforestation. The UK, for example, probably needs to increase tree cover from about 12% of land surface to around 30%, the level achieved in all other large European countries.

Familia Torres, the entity that controls the largest wine business in Spain, asked me to write a blog post on this subject. Torres is a world leader in emissions reduction and adaptation to climate change. At the same time, it is reforesting large areas in Spain and Chile. Its plans for southern Chile envisage a plantation of at least 5,000 hectares. This alone is at least half the annual rate achieved in the whole of the UK.

The blog post is here

'Massive overbuilding' of renewables is the way to 100% decarbonisation

This note argues that ‘net zero’ energy is likely to be most cheaply achieved by a huge expansion of renewables combined with hydrogen as a storage medium.

In particular, I look at the first stage of this strategy: the building of sufficient renewables capacity to provide all UK electricity, rather than all energy. I use data from the month of September 2019, showing that a 6.2 times expansion of wind energy supply would have created a sufficient electricity to at least cover current needs about 62% of the time. At times of surplus, up to 30 gigawatts of electricity is assumed to be converted to hydrogen. This hydrogen is then used to make electricity in the 38% of half hour periods when renewables supply is insufficient, through either combustion in a hydrogen CCGT units or the use of fuel cells. The supply from a 6.2 times multiple of current wind energy would have covered total electricity demand in each half hour of the month. No other capacity would be required, either from fossil fuel or, indeed, other renewables.

Hydrogen pres 7.jpg

I use projected 2025 costs to assess the financial implications of this. The recent offshore wind auction produced prices as low as £39.50 (in 2012 money) per MWh. After applying CPI inflation to this number, the price would be about £51 in 2025. I then use estimated costs to calculate the price for converting surplus electricity to hydrogen and then back to electricity. Using these estimates, I suggest that the cost of fully renewable electricity system is only slightly more than today’s electricity supply pattern, updated to 2025 prices.

Finally, I postulate that this calculation is too pessimistic and that cost trends in renewables will make massive overbuilding of renewables cheaper than any alternative by 2025. Specifically, the expansion of renewable electricity as a source for replacements for liquid fuels will aid the economics of the proposed approach.

I believe the analysis contained in this article is the first attempt to estimate the financial implications of the strategy of moving to full reliance on renewables in the UK. It uses many uncertain estimates, strong assumptions and incomplete logic but I believe helps us begin to look at the impact of a radically different strategy for decarbonisation.

Introduction

Complete decarbonisation of the energy system is a fiendishly difficult challenge. I believe the only way of achieving it is through a huge expansion of renewables. The intermittent large surpluses of electricity will be converted to hydrogen via water electrolysis.

The hydrogen can then be used to generate electricity when renewables are not providing enough as well as providing fuel for home heating, energy for industrial processes such as steel-making and a core ingredient for the manufacture of synthetic fuels that will replace fossil sources.

UK commentators are sceptical about this path. They tend to prefer a mixture of a much smaller amount of renewables, combined with gas power stations plus CCS. The problems with the conventional approach are three-fold: first, it does not fully decarbonise the electricity system because of the loss of methane and of CO2 to the atmosphere. 10% of emissions will probably never be captured. More methane escapes during the gas production process than previously estimated. Second, we cannot be sure that CCS will work, either technically or financially. It certainly hasn’t on the first power stations on which it has been tried. Third, the strategy is a poor route to full decarbonisation of the wider energy system because it doesn’t link electricity outputs to gas and liquid fuel networks.

These problems mean that we need to consider alternatives. This article tries to start the process of such consideration. It doesn’t present a definitive answer but does suggest a method for assessing whether ‘massive overbuilding’ of renewables might work. I think it is the only way of dealing with the intermittency of wind and solar and, second, the need to continue to have substantial stored sources of non-electric energy.

The approach

I assess the possible costs of substantial expansion of renewables by contrasting two potential routes forward: the government’s route and a plan which sees enough renewables installed to cover all needs for electricity in September 2019.

Chart 1

Hydrogen pres 2.jpg

The bizarre nature of real-time electricity reporting in the UK requires an investigator to make choices. Only large wind farms are connected to the main high voltage transmission network (‘the National Grid’). Other wind farms, and solar parks, do not have their output recorded immediately in a public database.

My work uses the public data provided by the Balancing Market Reporting Service (BMRS). I used the figures for 1-30 September this year. In the analysis that follows I just use extrapolations of electricity supply based on the data provided by BMRS about grid-connected wind.

My analysis refers to a potential 2025 situation and it assumes that demand remains constant between September 2019. This is unrealistic because the requirements from electric cars are likely to produce an increase in usage, although the growth in EVs is against a wider UK background of falling electricity demand as energy efficiency improves and de-industrialisation continues. Any lack of realism of the central assumption that demand will not change does not adversely affect the conclusions.

Chart 2

Hydrogen pres 3.jpg

The following slide shows how grid-connected wind varied across each half-hour period in September 2019 and compares this figure with the total recorded demand for electricity.

Chart 3

Hydrogen pres 4.jpg

September 2019 was a reasonably typical month in which about 20% of electricity demand was met by grid-connected wind. (But also noting that wind and solar that are not grid connected reduce reported levels of electricity use). The percentage varied from about 47% down to around 2%.

Many outline plans for the UK envisage an expansion of wind supply, particularly offshore, so that it covers a much larger fraction of monthly demand. Chart 4 shows the impact of doubling the amount of grid-connected wind. The amount of new wind power is restricted so that output will rarely exceed the total demand for electricity. Having double the amount of wind would produce an average supply of 40% of overall need, and a maximum of 94%.

The assumption of the analysts, such as the Committee on Climate Change, is that the remainder of energy demand will be provided by gas-fired power stations that collect and store the CO2 from the flue gas. (However I believe that nowhere in the world does a gas-fired power station collect and store CO2 currently).

Chart 4

Hydrogen pres 6.jpg

In the rest of this article, I will compare the first two scenarios (staying at today’s level of wind energy or doubling it) with a more radical approach that multiplies the amount of wnd electricity by 6.2 times. This would take grid-connected wind up to over 100 gigawatts from about 18 gigawatts today.

Why have I chosen a 6.2 times multiple? This is how much the UK would require to meet all its electricity demand over the course of September 2019. I have used the assumption that the conversion of electricity to hydrogen will be approximately 80% efficient in 2025 and, second, that converting ot back to power - through turbines or fuel cells – will deliver about 60% of the energy value of hydrogen. Both these numbers are slightly above today’s figures but technical progress is very likely to take efficiency to higher levels over the next few years.

Chart 5

Hydrogen pres 7.jpg

To cover September’s demand with grid-connected wind in 2025 will require enough turbines to provide about 124% of demand. The excess is required because of the efficiency losses turning power into hydrogen and back again. (The overall loss is 52% of the power used, meaning a round-trip efficiency of 48%).

 The electricity system will operate with a simple decision rule. If demand is less than supply, surplus electricity will be converted to hydrogen via water electrolysis. In the opposite situation, stored hydrogen will be used to generate electricity.

Chart 6

Hydrogen pres 8.jpg

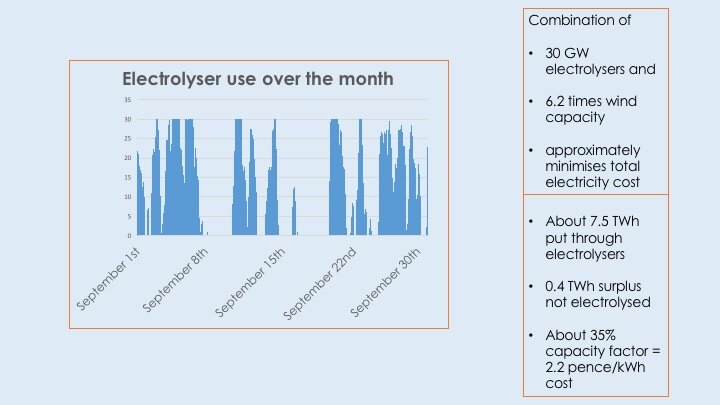
The system is assumed to have 30 gigawatts of electrolyser available. This means that enough electrolyser capacity is available to use surplus power at almost all times. Only about 5% of the surplus wind electricity is not used for electrolysis.

Chart 7 shows how much electrolysis capacity would be used over the course of the month.

Chart 7

Hydrogen pres 9.jpg

 The overall pattern of supply is laid out in Chart 8. Overall demand for the month is about 19.8 TWh with approximately 16.1 TWh met directly from wind. The remainder is provided by electricity generated from stored hydrogen that was created by electrolysis earlier in the month.

Chart 8

Hydrogen pres 10.jpg

How much hydrogen storage capacity would this month’s pattern of demand and supply required. The first thing to note from Slide 9 (11) is that if the UK had started with no hydrogen in storage on 1st September it would have been unable to meet the needs for the gas from about the 18th to the 27th. At the bottom of this period, the UK would have been short about 1,000 gigawatt hours, or one terawatt. This is an illustration of the necessity to have storage at the beginning of the month that is sufficient to cover periods of low wind power production

Chart 9.

Hydrogen pres 11.jpg

The results

Slide 10 (12) gives some of the key figures used for the financial assessment. The most important are probably the costs of wind energy and those of CCS and gas power production.

Chart 10

Hydrogen pres 12.jpg

The latest offshore wind auctions (September 2019) produced a low price of £39.65 per megawatt hour for a project on Dogger Bank that is scheduled for completion in 2023/24. This price was offered in 2012 price and since there has been inflation since then the actual price paid will be higher. By 2025, 2% yearly inflation will take this number to just over £51 per megawatt hour and I have used £51 in my assessment of the underlying cost of wind power by 2025.

The price assumed for new CCGT power stations with full scale carbon capture and storage is £89 per megawatt hour. This number is taken from the Net Zero report of the Committee on Climate Change of May 2019. The figure there of £79 appears to be in 2019 real numbers, and I have inflated this figure by 2% a year (the target for CPI inflation) and rounded the result to £89.

Electrolyser costs in 2025 are estimate at around £500 per kilowatt and the running cost £10 per kilowatt per year. An 8% cost of capital is used.

I have then calculated the full cost of all electricity delivered in the month of September 2019 using the figure of £51 for wind and £89 for gas with CCS. I do this calculation for three scenarios: a mixture of 20% wind and gas with CCS, a doubling of wind and gas with CCS and lastly, a 6.2 times multiple of wind with surpluses held as hydrogen. (I stress that this is a hypothetical exercise because the UK is very unlikely to be just wind and gas powered in 2025).

The costs of a renewables plus hydrogen route are given below

Chart 11

Hydrogen pres 13.jpg

The spreadsheet analysis shows that the 2 times wind route is likely to be the cheapest option in 2025, if the CCC is right about the price for gas power with CCS. But this second scenario is only about 3% cheaper than my proposal of wind plus hydrogen to cover all electricity needs.

Chart 12

Hydrogen pres 14.jpg

Even a small reduction in the cost of wind to £48 would mean that full decarbonisation using wind (or other renewables) and hydrogen would be cheaper than any other route.

Chart 13

Hydrogen pres 15.jpg


In addition, it is unclear whether the CCC has included any estimate in its gas costs for the impact of the uncaptured CO2 at the power plant or the methane escaping from production wells and pipelines.

Moreover, in one sense my proposal is unduly conservative. The ideal route for the UK and other economies to follow would be to use hydrogen not just for power generation but also for heating buildings and for creating synthetic fuels that substitute for fossil oils and gases. If this direction was taken, the UK could run its electrolysers at much higher rates of capacity utilisation, bringing down the hydrogen costs per kilowatt hour.

Can the North Sea provide more than 100 gigawatts of turbine capacity within British waters? Yes, almost certainly. Shell has estimated that 900 gigawatts across all national zones is possible and the UK has a large share of shallow water sites, such as Dogger Bank. The economics of onshore would be even better if the government were to encourage development on western coasts. Similarly, larger scale development of solar, which is now cheaper than offshore, would similarly help.

The economics of using what I call ‘massive overbuilding’ clearly needs more work. However  it does seem a highly competitive route to full decarbonisation without any of the problems caused by the need for carbon capture and offering a low cost route to synthetic fuel manufacture. 

Shell promises to plant some trees

Shell promises to plant some trees

Shell UK said today (10.10.2019) it would offset some of the emissions of its UK vehicle fuel customers by tree planting.

20% of its UK customers are members of its loyalty scheme and these people will be automatically enrolled in the offsetting programme. Very roughly, that means Shell is seeking to counterbalance about 3.5 million tonnes of CO2, or somewhat under 1% of UK domestic emissions.

It mentions that this offsetting will partly be carried out by investing in two British forestry schemes. These are

 Overkirkhope in the Scottish Borders

Longwood in Cumbria

 Shell’s announcement may have mislead readers. In fact, no new trees will be planted in these woodlands as a result of the investment. The projects are already in existence and Shell has bought a small fraction of what are called ‘carbon credits’ that are created after the trees are planted. And the numbers are truly insignificant, even if you believe that carbon offsetting works.

Longwood

Longwood is fully planted. It was completed in 2008. Details are here.

https://mer.markit.com/br-reg/public/project.jsp?project_id=103000000004434

As it is already in existence, and there appear to be no plans to extend it within the UK Woodland Carbon Code, no new trees will be planted as a result of Shell’s involvement.

It is a small scheme, of about 10-12 hectares, and will have anyway have insignificant effects on emissions. (To give a sense of scale, UK net reforestation is currently running at about 10,000 hectares a year, with a target of over 20,000 hectares).

 Shell has purchased credits of just over 100 tonnes of carbon at this site.

Overkirkhope

This is a larger scheme of about 100 hectares. But this still represents a infinitesimal fraction of Shell’s emissions.

The larger problem is that this project is sponsored by another fuel industry company. Allstar, the operator of a credit card that companies provide their employed drivers, already claims this scheme as part of its offsetting efforts and it owns the majority of the carbon credits.

Today, Shell owns 523 tonnes of CO2 offset from this project. This is less than 1% of the total that has been generated by Overkirkhope.

Net effect 

Shell has purchased about 700 tonnes of emissions credits from these two projects. This is about 0.02% of its yearly UK fuel emissions total, or far less than the CO2 it has been responsible for since the press release was sent out yesterday afternoon. I was unable to find a typical price for a tonne of forestry emissions credits but at today’s costs in the EU emissions trading scheme Shell would have paid just £14,000.

No new trees will be planted as a result of Shell’s involvement, although the company did also announce a partnership with the Scottish government to plant trees in the future. It projects a planting rate of 200,000 trees a year. That will cover about 100 hectares. To give a sense of scale, Ethopia planted 350 million trees in a single day earlier this year.

I find it very difficult to understand why large oil companies, with their near-infinite resources, cannot even do their greenwashing intelligently.

What Shell should have done is announce a significant land purchase on which it would plant millions of trees over the next years. Very roughly, to offset the 20% of its sales going to its loyalty card customers, it should have committed to perhaps 30,000 hectares of new forest a year. The UK is the least forested large country in Europe and it urgently needs new woodlands if is going to get to net zero. Shell could be an active participant in the efforts to decarbonise, instead of engaging in entirely insignificant hand waving.

This is not the way to achieve zero emissions in 2050 (or before). The CCC's May 2019 report

We can all be glad that the Committee on Climate Change recommends zero emissions in the UK in 2050. Equally, we should welcome the assessment that the cost of this policy is low, at perhaps 1-2% of GDP in their estimates.

 However a detailed reading of this long report raises some serious questions about the feasibility of the route that the CCC intends UK policy to follow. Put simply, we should have three main areas of concern:

Faith in technologies that are either untried or have already been shown to be uncompetitive

 ·      The CCC has always had faith in the viability of Carbon Capture and Storage (CCS). In the latest report, CCS is used to capture up to 175 million tonnes of CO2 a year and sequester this safely underground in 2050. This is equivalent to about a third of the UK’s current emissions. Nobody questions that CCS is technically possible, but nowhere in the world is this amount of CO2 currently captured and stored, let alone sequestered. The CCC’s latest report looks at many new methods of carbon reduction, such as the use of electrolysis to manufacture hydrogen, and dismisses them as ‘speculative’. However it never questions the potential scale and low cost of CCS in the UK. This is despite the acutely painful experience around the world of fitting carbon capture equipment to new or existing power plants. Without CCS, as the report quietly points out, ‘hard to decarbonise’ sectors, such as aviation will continue to ensure the UK has emissions of around 3 tonnes per person per year, not the ‘net zero’ that the CCC suggests. The magic of CCS is used to wash away the high level of the UK’s remaining emissions.

·      Similarly, the Committee continues with its extraordinary belief in the value of electric heat pumps as a means of decarbonising domestic heating, a very important source of current emissions. Once again, this faith is contradicted by experience; UK housing is simply too badly insulated to allow widespread heat pump use. Subsidies for air source heat pumps have been promoted for perhaps ten years in the UK, but takeup has been dismal. The reason, as perhaps the CCC should know, is that installations have often left householders cold and facing far higher energy costs than older gas boilers. The CCC’s faith in heat pumps sometimes appears almost theological, but is backed by negligible real world evidence.

·      Not surprisingly, the CCC also continues with its assumption that new nuclear power will come down sharply in cost and will provide a substantial portion of the UK’s power.  I don’t think any further comment is needed.

·      Similarly, despite the growing evidence around the world of the cost-competiveness of renewable hydrogen, the CCC stays with its favoured solution of partially switching to hydrogen but making it from natural gas, with the all the emissions implications. (The assumption is that these emissions are all captured and sequestered).

Failure to deal with some of the major questions surrounding the energy transition

·      Let me briefly list some of the things that are either not mentioned in the new report or are glossed over in a sentence.

o   Dealing with large scale and frequent electricity surpluses as the UK invests more in renewable technologies, particularly offshore wind. Even today, we are seeing renewables and nuclear filling almost all UK demand. As offshore wind grows, these surpluses will get larger and increasingly frequent. There isn’t a word about this.

o   Batteries are dismissed. There’s casual mention of home storage but nothing about large scale grid battery farms.

o   Onshore wind, the UK’s cheapest energy source, plays no role in the 2050 projection. This is the CCC avoiding political controversy rather than carrying out its core task. (Don’t believe me? Look at Table 7.2 where the costs of key technologies are tabulated. Onshore wind isn’t there).

o   Similarly, little is said about the crucial importance of home insulation in reducing emissions. The unpalatable truth is that most homes with cavity walls are now insulated and the major problem that remains is the 30% of homes with single solid walls. These are expensive and difficult to insulate but the CCC’s work makes negligible mention of this problem. This is despite the failure of previous government programmes to make more than a dent in the number of uninsulated houses.

·      New technologies, such as direct air capture of CO2, are crudely dismissed as unproven. There’s a good point here; full decarbonisation is going to require some techniques that don’t exist today at anywhere near cost competitiveness. But when the CCC chooses to question the viability of these new approaches it should use decent, up-to-date research. Direct air capture, which the report writes of as costing £300 per tonne of CO2 in 2050, is already being achieved at prices well below this level. Top flight academic research gives figures below $100 in the next few years. This has always been a serious problem with the CCC’s work; it chooses to avoid keeping up with recent trends in technology, perhaps for fear of looking like a naïve enthusiast for half-baked carbon reduction schemes. Scepticism is fine, but ignoring the proven potential for new technologies is not.

·      It’s part of my particular set of prejudices that the future world will make massive quantities of cheap electricity and use temporary surpluses (such as when an Atlantic gale is blowing) to provide the energy to make synthetic fuels cheaply. These zero net carbon fuels, such as replacement kerosene, can then be burnt in aviation or other tough-to-decarbonise activities. Other countries around the world are working on this today but the CCC sniffs and says research in the UK ‘should not be a priority’. Never miss an opportunity to miss an opportunity, I respond, thinking about the way that UK official bodies have dismissed unproven ideas, such as onshore wind in the 1990s or lithium ion batteries a decade earlier, that have gone on to become major world-wide industries. 

Statements of desirability are no substitute for proper plans

·      One of the most eye-catching recommendations in the report is for 30,000 hectares of reforestation a year. This is what is supposed to push the net emissions from agriculture down to zero. The problem is that this has long been the UK government target (or, more precisely, 27,000 hectares is). We are talking about 0.1% of UK land area a year, principally coming from replacing low intensity sheep farming with woodland. The idea is excellent, although I think the ambition should be doubled or tripled, but no UK government has ever successfully taken on the animal farming industry. Replacing the growing of sheep and cows for meat with woodland is one of the most powerful things that can be done to reduce emissions. But the CCC has nothing to say on how it might be achieved. And, by the way, the crying need for improved retention of carbon in soils (not just for emissions reduction but for food productivity as well) is almost totally ignored.

·      Similarly, the idea that the UK might start district heating plants in urban areas sounds wonderful. This idea has been floating around for decades. Nothing worthwhile has been achieved. The costs of building new heat networks in crowded urban environments are immense. Nothing will change this but there’s no examination in the CCC work of the practical difficulties.

Final point: The CCC’s job is to set targets, not produce fully worked-through policies. But, inevitably, a viable target needs a clear understanding of how it might be achieved. The CCC’s new report, which has raised the ambition for UK decarbonisation, should have been accompanied by a proper plan for achieving zero emissions. Instead it has just doubled down on its existing recommendations, first stated a decade ago, for a wildly impractical focus on CCS, nuclear, heat pumps and other dubious schemes. The things that are really shooting down in cost – solar, onshore wind, cheap electrolysis for making hydrogen – are curtly dismissed.

I’m sorry to be negative. The CCC does really important work but this report just isn’t good enough. More ambition please, less pandering to the perceived political practicability and more willingness to bet on the likely winners in the low carbon technology race.

What does a company have to do to fit itself for a zero-carbon world?  The case of Torres winery in Spain

Large companies across the globe realise that the gravity of the climate crisis obliges them to act. But moving from today’s reliance on fossil fuels to a business with a negligible carbon footprint is hugely demanding, particularly for companies facing shareholder demands for quick investment returns.

The Torres winery, headquartered not far from Barcelona, is the largest producer in Spain. Still family-owned after five generations, its vineyards produce a wide variety of wines, including some of the very highest quality. The company’s planning for a transition to a low carbon world, and its actions to address the impact of climate change on both the amount and quality of its production, seem to me to be exemplary.[1]

Wine has a central role in many cultures; progress on emissions reduction in viticulture can have a powerful exemplar effect across agriculture and other industries. The progress made by Torres shows how large enterprises around the world can productively respond to the threat from a changing climate.

Earlier in April, the company held a day-long session for wine writers and other journalists to present its strategy for adapting to climate change and reducing its CO2 impact. I summarise below some of what we learnt.

Why does climate change matter to a business making wine?

The quality of a wine is highly sensitive to the meteorological conditions the vine and its grapes experience during the growing season. Few industries are likely to be as quickly affected by climate change as viticulture. Variations in temperature, rainfall or wind affect all the world’s agricultural commodities but the volume of wine produced and, in particular, the quality of the product are exquisitely affected by the weather.

·      Higher temperatures affect wine in a particularly important way. The grapes mature earlier than they used to and then need to be picked. The slowly developing taste-enhancing phenolic compounds in the grape have not had sufficient time to mature. Changing climate affects the pleasure we experience from good wine.

·      Less well-known than the gradual, if erratic, rise in temperatures is the increase in the typical variability of weather. Extreme events, such as frost in April, now appear to be more common across the Torres estates around Spain and in other parts of the world. Once the buds on a vine have burst into growth a few hours of frost will reduce yields dramatically. Hail storms can have a similar effect.

·      As climate changes, drought is more likely in hotter regions such as Spain. Prolonged shortages of soil moisture will reduce yields and impair quality.

What can a wine producer do to adapt to the changes in climate?

The Torres family has been experimenting with methods to increase the resilience – in both quality and quantity terms – for well over a decade. It is adapting to the changing climate by:

·      Managing its vineyards differently

o   Rows of vines are planted 2.2m apart, up from 1m previously. This helps reduce the average and maximum temperatures experienced by the vines.

o   Torres is experimenting with not taking the leaves off its vines as the grapes ripen. This helps protect them from maturing too early.

o   The company is covering its vines with hail nets. This both protects against hail and reduces temperatures.

o   Rows of vines are planted north-south, rather than east-west to reduce the intensity of the sun on the plants, thus delaying sugar formation.

o   The vines are pruned differently during the winter period in order to create a different shape at summer maturity. The new shape, called Gobelet, mimics the way ancient Greek and Roman vines were trained.

o   Water management is increasingly important. Torres research has shown the benefit of a fertiliser called Polyter that helps hold water in the soil as well as dramatically improving root growth.

o   Torres contends that organic wine actually has a higher carbon footprint than conventional techniques. Organic production results in substantially higher emissions from fuel use and, more surprisingly, from fertilisers. Organic fertiliser from animal manure bears the high carbon burden of the cows and sheep that produce it. And the transport of manure is substantially more CO2 polluting than the use of standard fertilisers.

·      Changing the location of its vineyards and developing alternative varieties of vine, often based on older Catalonian vines.

o   Torres is developing new vineyards, such as high up in the Pyrenees. Sites are as high as 1,200 metres above sea level (higher than the top of Snowdon, the tallest mountain in England and Wales). Torres is currently growing a white grape variety at its highest location but says it may be able to switch to red at some stage. Red grapes typically need more heat than white. These elevations would have been inconceivable not many years ago.

o   In an experiment lasting over a decade, the company has searched out old Catalan varieties of vine that may be more resistant to extreme temperatures. These varieties have generally been found outside the traditional wine growing areas and are brought into the Torres laboratories to be ridded of viruses and eventually to check on the quality of wine produced. Some of the 46 ancient vine types look as they are better fitted to a hotter, drier Spain than the most popular varieties of today, many of which were initially imported from France and other countries with more moderate climates than Catalonia.

o   Another type of fertiliser being tested is made from dead insects arising from the manufacture of fish food. As with many things discussed at Torres’s presentation of its climate change strategy, the problem is that it will be 30 years before the full impact on the health of the soil is known.

Minimising the amount of CO2 produced by the Torres products

About 80% of the impact of wine making on greenhouse gas emissions arises away from the vineyard itself (‘Scope 3’ in the jargon). Torres often has an important place in the sales of its suppliers and so it is able to exert productive pressure on the CO2 emitted by the chain of the businesses that it works with.

·      One good example is the bottles used to carry wine. A standard glass bottle, used once, has a footprint of between 300g and 400g of carbon dioxide. A household buying 200 bottles a year will therefore add up to 80kg of CO2 to the atmosphere. That’s roughly one per cent of the typical footprint of a European person. Reuse that bottle six times and the number comes down to 75g, a lower figure than a PET bottle and equivalent to foil wine bag in a cardboard box.  Full circularity of glass is as good as any new materials.

·      In the last decade, Torres has reduced the full impact of each bottle [2], including all the elements employed to produce the wine, by almost 30% and is planning to get to 50% by 2030.

·      Some of the changes that the company has made itself are predictable. A 1.8 hectare (over 4 acres) PV array on the roof of its main warehouse, plus a boiler that burns the clippings from its vineyards and other organic wastes, contribute 25% of its overall energy use. It has begun to electrify its car fleet, although most of its vehicles are still petrol hybrids. The tourist bus that takes sightseers around the main estate is battery powered.

·      A huge new reservoir stores water for summer irrigation.

·      More unusually, it is just beginning a large scale experiment to use a highly innovative technology to capture and use the CO2 that bubbles up from the fermentation of the grapes. The Exytron conversion system (analysed here) will take up to 10% of the 2,600 tonnes of CO2 produced during the fermentation and convert it to natural gas (methane) for powering cars and vans.

·      Torres is also working with other major wine producers to set standards for CO2 savings and to share knowledge of emissions reduction techniques. As interest rises around the world in the emissions from our patterns of consumption, becoming leader in taking climate change seriously can only help the sales of Torres wines and those of other fine wine-makers that join with it.

·      Some of Torres’s emissions will be very difficult to entirely remove. So the company has started what it calls a programme of ‘insetting’, as opposed to offsetting, emissions. It is reforesting areas of Spain and Chile that it owns but which today have limited tree cover. The most important area of reforesting lies in Chilean Patagonia, where 6,000 hectares will be planted with trees. (Very roughly, the contribution of Torres towards carbon capture from photosynthesis will be equal to the recent promise by Shell to plant trees in the Netherlands, Spain and Australia to balance some of its emissions. But Shell is the larger company by several orders of magnitude).[3]


The quality of wine made in 2050 will depend on decisions made now. So many parts of the winemaking industry do have a culture that allows managers and owners to think several decades ahead. And many of the most successful wineries are still in family ownership; the importance of long-term stewardship of the company and its vineyards is often ingrained in the culture of these businesses.

 The wine industry, called ‘the rock star of agriculture’ by one of the speakers at the Torres conference is highly vulnerable to climate change but is thus able to make highly expensive long-term moves to mitigate its emissions and to act as an exemplar to other industries. I want other companies to copy Torres’s quiet determination to reduce its emissions to near-zero and to keep producing the highest quality wines at the same time.

[1] I visited the Torres headquarters two years ago to discuss its climate change programme and was invited back in April 2019 to give a presentation to its recent conference on the topic. I was paid for this presentation. I travelled to Barcelona and back to London by train.

[2] I believe that this assumes no recycling and reuse of the bottles.

[3] https://www.cnbc.com/2019/04/08/oil-giant-shell-has-a-new-carbon-footprint-plan-millions-of-trees.html

Making hydrogen from renewables is as cheap as making it from natural gas

A new academic paper shows that hydrogen made with renewable electricity is cost-competitive with smaller-scale production of hydrogen sourced from natural gas. Within a few years, the researchers say, water electrolysis will have become cheaper than manufacture from fossil fuels across all sizes of hydrogen manufacturing plant, including the very largest.

A chart from the paper comparing the current price for hydrogen paid by large, medium and small users with the breakeven cost of producing it from electrolysis

A chart from the paper comparing the current price for hydrogen paid by large, medium and small users with the breakeven cost of producing it from electrolysis

The conclusion has great significance. Low cost renewable hydrogen enables 100% decarbonisation across the global economy. Electrolysis will allow the world to generate huge, erratic and unpredictable amounts of electricity and use the temporary surpluses to produce hydrogen. This gas can then be stored for later use as a fuel for gas turbines, employed in fuel cells for transportation or converted to hydrocarbons that mimic fossil fuels such as oil and gas. Hydrogen is the vector, or link, that allows us to use electricity from wind and solar to provide almost all energy needs.

This important research shows that the falling price of renewable electricity, combined with declining electrolyser prices and improved efficiency enables complete replacement of all sources of fossil energy. In summary, we can see a route to a near-costless transition to a low carbon economy. The world has not yet arrived at a point where renewable sources of electricity are always cheaper than oil and gas but that target is now in sight.

Commentators have predicted the arrival of a hydrogen-based economy for the last thirty years. Is this paper yet another example of unsupported optimism? I suggest that sceptics might look at two news items over the last couple of days.

·      On Monday, NEL, the leading Norwegian manufacturer of electrolysers, announced a contract to build a 2 MW plant in Switzerland as part of a 30 MW contract. The eventual size of the electrolysis equipment is expected to be 60-80 MW to supply heavy vehicles on Swiss roads.

·      In Canada, Hydrogenics, one of the world leaders in PEM electrolysis, the technology likely to dominate in the next few years, said it had sold the world’s largest ever electrolyser system to Air Liquide. This 20 MW unit is approximately eight times the size of the largest existing Hydrogenics installation and twice the size of the previous largest contract in the world.

Both the frequency of electrolyser sales and the scale of the orders – which I guess will probably move to the 100 MW plus scale within 18 months – show a technology rapidly improving in competitiveness.

The main conclusions of the paper

·      The break-even price of renewably-sourced hydrogen made from wind electricity in Germany is now approximately €3/kg. This is below the price of hydrogen sold to small and medium customers made from steam reforming of natural gas. A kilogramme of hydrogen contains about 39.4 kilowatt hours of energy. So the cost price per kilowatt hour of hydrogen is just over 7.5 Euro cents. (For comparison, the price of the energy in crude oil is around 5 Euro cents per kWh at $65 a barrel).

·      By the late-2020s, the cost of hydrogen will fall to little more €2.50/kg, or around 6.3 Euro cents per kWh. At this level, hydrogen is cheaper to make from the electrolysis of water than from fossil fuels in large refineries and ammonia plants, the main global users of the gas.

·      The increasing competitiveness of electrolysis derives, in the researchers’ view, from falling electrolyser costs, cheapening wind power and increased variability of market prices for electricity. (The paper focuses on wind not solar).

·      The researchers assume that operators of wind farms will sell their power into the electricity market if the price is above a certain level. If the price falls, production of electricity will be diverted to electrolysis. The increasing variability of electricity prices as more and more wind (and solar) arrives on electricity grids allows electrolysers to work with electricity that is typically cheaper each year, as more hours of electricity production occur when prices are below the level at which it is more profitable to produce hydrogen.

·      The paper makes assumptions about electrolyser costs and efficiencies. Today’s PEM electrolysers are recorded as costing around €1600 per kilowatt of capacity. That number looks high to me since ITM Power, the leading UK electrolyser manufacturer, is quoting €800/kW for 10 MW installations. I suspect that the estimates in the paper for the price of electrolysis and, to a lesser extent its energy efficiency, are possibly too pessimistic. This is an important shift and ITM’s electrolyser price would reduce the break-even cost of hydrogen by at least 1 Euro cent per kilowatt hour, making electrolysis cost-competitive within a few years across all size ranges.

·      Wind turbine costs are also seen as falling, resulting in lower average prices of power, also helping the economics of renewable hydrogen. Making hydrogen from solar PV, particularly in sunny tropical regions would be even cheaper.

To quickly summarise, this is an intricate, carefully argued paper with real economic logic. It provides the intellectual framework that shows why we are seeing rapidly increasing interest in renewable hydrogen around the world.

To be clear, the researchers are not necessarily arguing that hydrogen should be used more for energy purposes in such users as fuel cell cars or hydrogen ships and trains. They are simply saying that hydrogen manufacture – currently mostly for oil refining and ammonia manufacture – is now almost as cheap using electrolysis as the traditional method of steam reforming. Hydrogen is responsible for about 2% of global emissions today.  That will disappear with the switch to electrolysis. More importantly, hydrogen allows the world to vastly expand its renewable electricity infrastructure and store surpluses as either hydrogen or other hydrocarbons that can easily be made from the gas.


Carbon taxation without increasing inequality

An eminent group of American economists, including all living former heads of the Federal Reserve, has called for a carbon tax. Despite a growing global scepticism about any recommendations from the economics profession, the proposal deserves serious consideration.

The central idea is that the production of goods and services that cause carbon emissions should result in a tax payment to the government. Use a megawatt hour of electricity and your company or household will pay a price that includes a fee related to the amount of CO2 released to the atmosphere as a result of the production of this power. A company producing a tonne of steel and will owe a carbon tax related to the emissions from the coal used to make it.

A carbon tax therefore raises the price of goods and services that have burnt fossil fuels in their production. The US economists behind the latest proposal suggest that the revenue raised from the tax is then entirely redistributed back to individuals as a flat rebate. Each person, for example, might get $200 annually as his or her share of the total funds raised by the tax.

Almost all economists like carbon taxes. This mechanism avoids the need for many regulations and disruptive market interventions. Taxes push both producers and consumers towards low carbon ways of providing goods and services without absolutely obliging anybody to change their behaviour.

Electorates are more equivocal. The ‘gilets jaunes’ movement in France sprang into existence partly as a reaction to the rise in the price of vehicle fuels as a consequence of an increased carbon tax. Badly designed levies penalise the less well-off because poorer households may spend a larger portion of their income on energy-intensive purchases. The people of the Canadian province of Alberta were not happy when a carbon tax was introduced there in 2017. Opinions are still very divided even though the average cost to a single person earning under C$95,000 is calculated by the government to be C$286 but the yearly rebate slightly more at C$300.[1]

The UK needs to start discussing whether a carbon tax would work here. The discussion should particularlexamine how a carbon tax could be designed so that it doesn’t affect poorer people adversely.

This article looks at the patterns of household expenditure in the UK and assesses how a government could make sure that the net effect of a carbon tax might be broadly redistributive towards the less well-off. This is an important issue: households in the top 10% of expenditure spend 9% of their income on high carbon goods and services while those in the lowest decile devote over 15% to these products. However, if a 10% carbon tax were to be employed, and the proceeds then redistributed equally to households, the highest spending group would lose about £190 a year and the lowest would gain about £160.

I discuss more complex - and much more obviously redistributive - schemes in the note below but I tentatively conclude that a simple tax, working similarly to VAT, would probably work best. The taxation income then needs to be handed back to households as an equal lump sum for all.

 Patterns of household expenditure

I use the Living Costs and Food Survey (LCF), a long established and well-regarded annual report on how a very large sample of UK households spend their money. This survey divides households into ten deciles (10% groups), ranging from the lowest to the highest spending. The decile spending most had a weekly expenditure of £1222 in the 2018 survey, which is almost six times as great as the lowest decile (£213). Richer households tend to include more people but the expenditure differences per person are still very marked.

In summary, analysis of the LCF shows that the poorest decile spends more of its income on items I have defined as typically ‘high carbon’. A flat rate carbon tax would therefore hit poorer households harder and the article assesses how it might be possible to avoid this politically suicidal problem.

I look at four types of expenditure

a)    Energy for the home

b)    Purchase of meat and meat products for eating

c)     Petrol and diesel for running a car or a motor bike

d)    Air tickets

Energy for the home

Most households buy gas and electricity. Some only buy electricity and heat their home with it. Others use electricity and another fuel for heat, such as oil.

This is the pattern for how much homes spend on domestic energy per week. The left hand axis is the number in pounds and on the right hand side this figure is expressed as a percentage of the household’s total expenditure.

Chart 1

Living Costs and Food Survey for 2017-18, published January 2019

Living Costs and Food Survey for 2017-18, published January 2019

This chart shows that the amount households spend on domestic energy is only weakly related to income. The homes in deciles 3 to 9 typically pay between £20 and £25 per week for their power and heat. The lowest spending households do spend less than richer homes but the difference is not especially marked.

As a percentage of income, the bottom decile spends over 8% of its income on energy but the richest group spends just 2.6%.

This means that any carbon tax needs to be designed with particular care. Adding 20% to gas and electricity bills would cost the lowest spending decile almost £3.50 a week, or over 1.5% of their expenditure. The richest 10% would lose just half a percent of their expenditure.

The key question is: how could consumption of household electricity be taxed in a way that reduced consumption but did not particularly affect the less well-off?

 In parts of the US, for example, electricity gets more expensive the more the household consumes. The first few thousand kilowatt hours per year are priced at one level but as consumption rises, the price per unit increases. (There are no carbon taxes involved of course). One way of discouraging high levels of consumption of gas and electricity would be to have a pricing schedule in the UK and elsewhere that got more expensive as usage increased. This would mean that richer people, who generally live in larger houses, would typically pay much more for their power and gas. And if the carbon tax were imposed as a percentage of the price of the energy, it would disproportionately affect the better off. Theoretically, the tax could be made progressive.

 A pricing structure for energy that obliges suppliers to charge customers more for larger amounts supplied would be extremely difficult within the UK’s energy market. Suppliers would target customers using more energy. (In the US, rising rates happen in markets with just one supplier, usually either publicly owned or heavily regulated).

The obvious alternative is to impose a rising percentage carbon tax on domestic bills. Users of more energy would pay an increasing proportion of their bill as tax. So for example, the first 2000 kWh of electricity might cost 14 pence each, with no carbon tax, but then the costs rise by 2p per kilowatt hour for each extra 1000kWh. (The average domestic user in the UK not using electricity for heating uses about 3,000kWh). The same ideas would apply to gas as well.

A customer buying 100% renewable electricity, or low carbon gas would not see this cost escalation. This would encourage the purchase, and supply, of renewables and nuclear power. It would boost the production of biomethane from anaerobic digestion and other sources.

 Such a tax would raise the incremental cost of energy - possibly sharply - for non-renewable customers and really encourage efficiency.

 What are the problems with such a pricing structure? First, it is a blunt tool from an equity point of view. Some less well-off people have large houses and would be penalised. Or they live off the gas grid and so have to use substantial amounts of electricity for heating. Such households would disproportionately suffer from the high price of electricity for larger consumers. Of course, the obvious choice would then be to buy renewable electricity to avoid the higher costs for heavy users. This might very substantially incentivise the development of new renewable sources.

A tax that increased as domestic usage rose could be broadly progressive. The revenues generated by the carbon tax could then be distributed on a flat per capita basis, meaning that lower income households might be net beneficiaries.

 b) Purchase of meat and meat products for eating

I don’t know of anywhere that imposes a carbon tax on foods. But, logically, the world probably should try to use taxation to reduce the consumption of high carbon foods, particularly those from ruminant animals such as sheep and cows. (The recent Lancet report on improving the global diet put the share of all food production in total carbon emissions at 30%. Others might be happier with a figure nearer 20% but there’s no doubt that agriculture really matters in the contest to limit climate change).

I looked at the pattern of expenditure on meat and meat products. The Living Costs and Food data shows that there is a steeper gradient to this item; richer households do spend more but the percentage of their income expended on meat is lower than for less well-off groups. Although the bottom decile spends about £6 and the top almost £20, the percentage of expenditure falls from about 3% to 1.6%.

Chart 2


Meat and meat products.jpg

 Perhaps it is not appropriate to tax all meat products; the climate change impact of beef and lamb is disproportionate and it may be logical to focus on these foods. The excellent Living Costs and Food survey doesn’t give us perfect data. We can track purchases of the meats themselves but we cannot know how much of a line called ‘meat products’ contains beef or lamb. Nevertheless, I thought it would be helpful to show the chart of beef and lamb purchases

Chart 3

beef and lamb.jpg

The amounts spent rise slightly more sharply with income and, as a consequence, the share of income spent on beef and lamb is flatter across the deciles.

Personally I think we should investigate the possibility of adding VAT (20% value added tax) on all products containing beef, lamb or the meats of other ruminants, such as deer and goats. Logically, it also makes sense from the point of view of carbon avoidance to tax milk and milk products from ruminants. VAT is already generally charged on meats sold in restaurants.

This policy would cause outrage that any such policy would cause among farming groups and many individual households, even though producers of other meats, such as pork and chicken, would probably benefit. Nevertheless, I think VAT on foods with a very high carbon impact makes very good sense.

 Assuming that about 50% of all items classed as meat or meat products in the consumer survey actually contain cow or sheep products, a rich household will pay a tax of about £100 a year and one in the poorest decile will see a £30 surcharge. If all the carbon taxes from meat were then given back to households, the average rebate would be about £60. Poorer households would be net beneficiaries.

 c) Petrol and diesel for running a car or motor bike

Motor fuels are already heavily taxed. In the UK, duty and VAT take more than half of the price of petrol and diesel at the pumps.

The percentage of total expenditure spent on motor fuels rises across the deciles, with an unusual exception of the highest income households. Although this group spends more in cash terms than the next decile down, the percentage of income spent nevertheless falls because the total expenditure of the richest families is almost 50% greater than the second decile.

 Chart 4

Motor fuels.jpg


This pattern of expenditure makes it possible, in theory, to increase the duty (the old fashioned word used in the UK for the tax on petrol and diesel) on fuels without increasing income inequality across society.

 A carbon tax of, say, 15p per litre on motor fuels would raise the average household’s expenditure on motor fuels by just over £100. If the tax system rebated this equally across all households, the average home in at least the lower four deciles would see a net gain.

But, as the French found three months ago, some people with relatively low incomes, particularly those living in areas with poor public transport, spend a much larger proportion of their total expenditure on driving a car. They would therefore disproportionately suffer from a tax increase and a £100 rebate would not be sufficient to recoup their costs. Very, very roughly any household having to travel more than 11,000 miles/18,000 km a year in a small modern car would see a net cost from a 15p/litre tax.

I cannot think of an easy way to make a carbon tax on motor fuels easy to implement politically. Some people will suffer heavily from a duty imposed on fuels. It can be argued that governments should invest in better public transport in rural areas or increase the subsidies for electric cars but neither of these measures will work rapidly enough to avoid the cash costs to poorer households necessarily using a car for high mileage.

 d) Air tickets

The situation is much easier when we come to look at air travel. The Living Costs and Food survey does not separately list the expenditure on ticket purchases but the ONS very kindly provided me with the data for 2017. This shows a very steep increase in money spent on air travel as household expenditures rise. Households in the top decile spend almost £1,000 a year on tickets, and the bottom group spends less than a tenth of this figure. So a tax on air travel will disproportionately affect the rich.

Chart 5

air travel.jpg

Increasing air ticket prices by an average of 10% would produce a sum equal to about £35 a household compared to the typical cost across the bottom three deciles of about £12. A tax would therefore have a positive effect on income inequality.

International rules forbid the levying of taxes on fuel for international air travel. So any tax cannot directly be on the carbon emissions from burning the aviation fuel. However a carbon tax can certainly be levied on the price of the ticket, as indeed it already is in the form of air passenger duty (APD).

The simplest way of attempting to decrease air travel is to increase the cost of flying through a higher rate of tax. But a case can be made that a better route forward might be to allow each person one or two flights a year and then to increase substantially the cost of extra travel beyond these flights. The idea is that people going on holiday to Spain once a year shouldn’t be burdened with extra tax.

Others have already suggested a voucher scheme to achieve this. Each individual would get the rights (presumably expressed in digital form) to perhaps a couple of flights a year and would be able to sell these rights to others for cash. Just under 50% of UK adults do not take a single flight in any twelve month period and these people would be able to cash in their vouchers and make some money from not contributing to the destruction of the planet.

The value of these vouchers on the open market would be heavily influenced by the volumes issued. If more vouchers were issued than flights taken, then the value would zero, or close to it. But if the number of vouchers were adjusted to achieve a price of, say, £20 a voucher then people taking no air flights might gain a reasonable benefit.

 Summary

 A carbon tax that increased the price of each of these four categories of goods and services by 10% would increase inequality if the revenue was simply added to the existing government budget. 15% of the average expenditure of the least well-off decile % goes on high carbon goods, of which much is spent on home energy. This compares to a total of 9% of the richest households.

Chart 6

Living Costs and Food Survey for 2017-18, published January 2019

Living Costs and Food Survey for 2017-18, published January 2019

However if all the revenue was simply handed back equally to households, perhaps by something as simple as a reduction in council taxes, carbon tax could become redistributive. Speaking personally, I prefer this outcome to the more complex ideas I briefly discussed above.

As the chart below shows, the richest decile households spend over £5,000 a year on the four categories I discuss. The least well-off decile spends about £1,600. A 10% tax on the four categories would add about £165 to yearly bills in the bottom expenditure decile but £517 to the richest group. If the money raised were then redistributed equally, each household would get about £329 a year back. This means that the bottom four deciles would gain income, the next two see a roughly neutral result and the richest four deciles suffer an income loss.

Chart 7

Living Costs and Food Survey for 2017-18, published January 2019

Living Costs and Food Survey for 2017-18, published January 2019

However if all taxes were rebated to households as a lump sum, perhaps as a reduction in council tax, then the net impact would be redistributive. Across all expenditure deciles, the average impact of a 10% rise in the price of the high carbon goods specified here would add £320 to typical bills. But lower expenditure groups would face a smaller absolute increase in their bills. The bottom group will be asked to pay an average of £160 in carbon tax. A rebate of £320 would therefore save them money as shown in the chart below.

Chart 8

Living Costs and Food Survey for 2017-18, published January 2019. Calculations by the author.

Living Costs and Food Survey for 2017-18, published January 2019. Calculations by the author.

It seems to me that a relatively simple scheme like this could work. But it doesn’t solve the problem of poorer households with high energy bills or which need to travel long distances by car. People in these groups cannot easily be protected. All the more reason to plan now for major improvements in public transport and better insulation in homes. To be slightly more specific, a fair carbon tax must be accompanied by transport improvements that benefit the less well-off, and not simply make it easier to get to the capital from other cities (I am referring to HS2, the vanity project that provides a new London to Birmingham link). It must also target substantial and inexpensive improvements to the quality of the UK building stock rather than the ill-designed schemes that governments have been playing with over the last decades. 

[1] https://www.alberta.ca/climate-carbon-pricing.aspx

[2] Council tax in the UK is a highly regressive property tax

Lessons from the collapse of GE

(This article was written by Charlie Donovan and me and is published here by the Imperial College Business School).

Investors worried about carbon risks need to be looking at industries beyond coal, oil and gas

In October 2018, GE parted company with John Flannery, its CEO for the previous 14 months. Announcing the departure, the business also said it would write off about $23 billion in its power division, its largest segment and the world’s most important manufacturer of gas turbines.

The question many are asking is whether this is evidence of the implosion of a “carbon bubble”. While it is too early to draw firm empirical conclusions, we do see lessons to learn. There is great potential for an unexpected reduction in business value from a global swing away from fossil fuels and the competitive threat of cheaper solar and energy storage. But that may occur in economic sectors where people have spent little time looking for signs of trouble.

When Flannery became GE’s CEO in August 2017, there were few hints of the catastrophic problems to come. In the results presentation just after he was appointed, power division revenues were up five per cent year on year, and the conglomerate expressed great confidence in the future of its gas turbine sales.  At that time, the share price was $29. On the day before Flannery left, it had fallen to settle at $13 per share, wiping out over $100 billion in shareholder value.

The absolute size of the market matters far less than whether it is expanding or not

Thus far, investors concerned about the impact of climate change on asset valuations have focused almost exclusively on the fossil fuel corporations. The crisis at GE shows they may be looking at the wrong businesses. Coal, oil and gas out of the ground should see gradual decline over time, but it is likely to be a slow, mostly predictable process. There are nearly one billion cars on the world’s roads today; they will continue to use gasoline and diesel until they are scrapped. Even with massive new electric vehicle penetration, the structure of the global refined oil product markets puts an inertial brake on demand decline.

The collapse in the markets for GE Power’s goods and services, on the other hand, happened quickly. It raises an interesting hypothesis that the companies downstream in the fossil fuel value chain may suffer first, not the upstream owners of the carbon products assets themselves. While it’s too early to judge whether the crisis at GE is indicative of a broader trend for downstream suppliers, there are some lessons to be learned. We offer some suggestions here to those watching for early signals of carbon risks in other industries.

1, New large gas turbines

GE remains the world leader in manufacturing new turbines for large gas-fired power stations. In March 2017, it estimated an average of 78 gigawatts of turbine capacity would be installed across the globe in the years to 2026. By mid-2018, GE told its investors the number would actually be below 30 gigawatts for 2018 and about the same for the following two years. This year’s global sales represent a reduction of about 45 per cent on estimates of little more than a year ago.

Analysts had uniformly agreed with GE’s earlier forecasts. Few saw the dip coming as it was universally assumed the turbine market would continue to be buoyant. Natural gas would, after all, act as a standby fuel for variable solar and wind power. The reality was different.

There are nearly one billion cars on the world’s roads today; they will continue to use gasoline and diesel until they are scrapped

After growing at an average of 4.0 per cent a year in the previous 10 years, electricity production from gas turbines only rose 1.4 per cent in 2017. Renewables have been growing faster than expected, now providing more than half of the world’s annual increase in power requirement. In the first three quarters to June 2018, 32 gas turbines were ordered from GE, compared to 51 in the same period of the preceding year. And it’s not just GE: Siemens, its largest competitor, reported lack of demand pushed down the price for turbines 30 per cent between financial years 2014 and 2017. GE’s reversal was even more spectacular:  turbine revenues were down 49 per cent in the third quarter of 2018 versus previous.

The wider lesson: Producers of capital goods such as turbines that are sold to provide extra capacity are vulnerable to even small changes in the rate of growth of their markets. The absolute size of the market matters far less than whether it is expanding or not. In another example, the construction of new petrochemical plants is sound business if oil use is growing – but if it is stable, or even slowing, then suppliers of new equipment will suffer. Both sale realised prices and quantities sold can fall sharply.

2, Maintenance revenues

As the demand for gas-generated electricity stopped rising, GE’s revenues were also affected by a fall in the needs for both emergency repairs and planned maintenance. Power plants that work a smaller number of hours per year typically fail less frequently. GE reported in October 2018 that service orders were down 15 per cent in the third quarter of 2018 compared to the year before. Even an activity that must have seemed extremely secure – the servicing of the huge installed base of GE turbines – was vulnerable to the small shift away from gas as a fuel for electricity.

The wider lesson: Small changes in utilisation can produce substantial swings in revenues to those supplying services. Note the price of ocean freight transportation is highly sensitive to variations in the amount of oil being shipped: a fall in volumes produces stark reductions in rates, reducing the returns for owning tankers.

3, Performance improvement products

Older power plants can benefit from GE’s advanced gas path (AGP) product, which improves the efficiency of converting gas into electricity. This activity has also seen similar downward pressure on sales. The latest public data showed sales of six AGP’s in the first quarter of 2018, versus 21 a year before. AGP sales have fallen partly because gas turbines are tending to operate fewer hours per year. A utility deciding whether to invest the millions needed to improve performance will see far lower returns if the power plant is expected to be idle for most of the time.

The wider lesson: Similar effects are going to be seen, for example, in conventional car engines. Why should auto manufacturers continue to back component suppliers who promise better fuel efficiency if the total sales of internal combustion engine cars start falling as electric vehicles move into the mainstream?

4, Sales of smaller gas turbines 

GE also sells smaller gas turbines that are similar to jet engines. These are normally used to provide electricity to meet short peaks in demand. Everybody expected this segment to be a bright area of growth. The swing towards renewables was expected to produce a greater need for turbines that can respond within seconds to a call for power.

Once again, the reality has proved to be very different: in the second quarter of 2018, GE took orders for three “peaker” turbines, compared to 12 in the same quarter of 2017, a reduction of 75 per cent. The security offered by these turbines may become increasingly unnecessary as large commercial and industrial customers, and utilities, get better at adjusting their power needs to match short-term availability. Improving economics for large storage batteries is also undermining the role of “peakers” around the world.

The wider lesson: The growth of alternatives to fossil fuels will not necessarily result in increases in sales of products that are designed to make “old” work well alongside “new”. In the case of automobiles, for example, many people see plug-in hybrids as a bridge to the world of fully electric transport. But the battery-only car is improving so fast that it will be fully competitive with the internal combustion engine within a few years with the right business models. Suppliers focusing on components for hybrid cars could see rapid reductions in demand.

All the parts of GE’s flagship division have struggled against the headwinds caused by the growth of renewables and the improvement in ability of utilities to intelligently match electricity supply and demand. The value destruction of tens of billions of dollars of GE market cap occurred after solar and wind had grown to just eight per cent of world electricity output. Let this be a warning. Asset values for firms supplying the fossil fuel economy may fall precipitously with little warning and far earlier than could be foreseen. Investors need to broaden their concerns over carbon bubbles to a wider group of businesses.

Is the FT right to carry misleading advertisements from Exxon?


Anyone browsing the Financial Times web site this week may have seen a startling juxtaposition. An article on New York state’s lawsuit against ExxonMobil for allegedly misleading investors over its response to the threat of climate regulation was accompanied by a large advertisement trumpeting the same company’s commitment to low-carbon biofuels derived from algae.

In fact, the algae advertisement has been plastered over the FT web pages for weeks, often placed at two different points in the same article. Its unsubtle purpose has been to offer readers a different vision of Exxon. Instead of the raw climate denial that characterised the company’s public statements a decade ago, today’s Exxon has decided to market itself as a leader in alternative fuels.

Source: New York Times front page

Source: New York Times front page

I think the Exxon advertisements present a highly partial and inaccurate view of the company’s actions and intentions. I question whether responsible media owners should accept advertising which is as misleading and incomplete as this.

This article tries to make my case that the Financial Times should have demanded more evidence to support its advertiser’s assertions.

(The Appendix at the end gives a bit of background about Exxon’s ambitions and actions). 

·      The scale of Exxon’s plans, and the company’s commitment to carrying them out

Exxon has been working on algae for at least nine years. In mid 2018, Exxon said that it would enter a new phase in the research by farming algae in outdoor ponds. It suggested that ‘the goal is to reach the technical ability to produce 10,000 barrels of algae biofuel per day by 2025’. This choice of words is important; it is not a promise to invest in production capacity, nor a commitment to harvest algae, but a statement of intent to get to a position where it might be possible to produce a volume of fuel. Exxon is not suggesting that a decision to invest in building a commercial facility is close.

Is 10,000 barrels a day a significant amount? World oil production is now about 100m barrels a day (b/d), or approximately ten thousand times as much. Exxon alone processes about 5m b/d through its refineries, meaning that the algae biofuels would account for 0.2% of its throughput if did go ahead and build a 10,000 barrel a day farm.

Exxon’s advertisements in the Financial Times make no mention of the relatively small scale of algae’s potential even if the company does decide to press ahead with commercial production.

·      The financial commitment of its research

Exxon announced in 2009 that it would conduct sustained research into the viability of growing and then harvesting algae as a source of oils from which to make motor fuels. Its partner since then has been Californian company Synthetic Genomics, which has genetically engineered a common form of algae to maximise its oil production.

Exxon indicated in 2009 that it would spent about $600m on the quest for commercially viable production.[1] It intended to work with Synthetic Genomics for ‘five to six years’to create the knowledge that would allow full scale commercial manufacture’.[2] (Five to six years from 2009 would be 2014/2015).

To provide some sense of the scale of the proposed investment, the expenditure of $600m over ‘five to six years’ would equate each year to approximately half of one percent of the yearly profits of Exxon in 2017, which amounted to just under $20 billion.

The advertisements focus on a research activity of Exxon which it suggests is fundamental to its future but which is actually a trivial use of its free cash flow.

·      The possible demands for land for tanks to grow algae

How much land would a farm producing 10,000 barrels a day use? Exxon states that it expects to grow algae that will produce about 15,000 litres of fuel per hectare per year (1,600 US gallons an acre).[3] That means a 10,000 b/d farm would occupy around 39,000 hectares, about 95,000 acres. Very roughly, this would be equivalent to a square of 20 km by 20 km, about four times the size of Paris. Although Exxon might have the ‘technical ability’ to build a facility of this size by 2025, it is vanishingly unlikely to be able to create a plant of anything more than a small fraction of this.

At Exxon’s claimed levels of algae productivity - which are higher than many scientists believe are possible - it would take about 18% of the UK’s land area given over to agriculture to provide enough fuel for the country’s transport.[4]

The ubiquitous advertisements on the FT made no mention of the huge land use implications of a switch to algae.

·      Are algae biofuels ‘low-carbon’?

Exxon probably wants us to assume that biofuels made from algae are good for carbon emissions. On its websites it says that ‘algae biofuels could be the low-emissions fuel of the future’.

Yes, we can expect some reductions in CO2 from diesel made from algae. But on other Exxon web pages the company says that ‘on a life-cycle basis, algae biofuels emit about half as much greenhouse gas as petroleum-derived fuel’. Algae need to be fed with nutrients, grown and harvested with machinery and converted into oil in a refinery. All these activities have carbon costs.

Transport today emits about 8 billion tonnes of CO2 a year, approximately 25% of total energy emissions. This would fall to 4 billion tonnes, according to Exxon, if oil were replaced by algae. But, as we now understand, the world needs rapidly to move to zero-carbon transport.

Algae biofuels help, but not by much. They certainly do not take the world safely towards a zero-carbon future. Nowhere in the advertising is this mentioned.

·      How does algae production compare with other sources of power?

What about the alternatives? For most parts of the world, electricity made from solar power will provide a far more effective source of energy for transport.

First, let’s look at the cost of electricity compared to the price of oil. In sunny countries, solar PV is now providing power at a cost of around 3-4 US cents per kilowatt hour. At today’s price of around $75 a barrel, the raw cost of the energy contained in oil is somewhat higher at about 4-5 US cents/kWh.

More importantly, internal combustion engines are about a quarter as efficient as electric motors in terms of the energy needed to move the car at a standard speed. So oil today is over four times as expensive as energy from solar in a sunny country. Even in the UK PV is cheaper as a source of motion. And, by the way, Exxon never contends in its advertising or on its web sites that biofuels will be any less expensive than fossil oil.

What about the energy collected per unit of land area? Solar energy collection needs space, just like algae tanks do. But even assuming Exxon’s statements about the energy productivity of its proposed algae farms are correct, solar PV will typically be at least 4.5 times as efficient in the use of land.

Taking into account the greater efficiency of motors when compared to internal combustion engines, that difference becomes eighteen-fold. This means instead of using 18% of the UK’s agricultural land area to grow the algae to make fuel, we need only give over 1% to solar PV to generate enough power for all the country’s transport needs. (Much of this energy would have to be stored, of course, so this is not a full comparison).

The huge inefficiency of using biofuels rather than electricity to power transport vehicles is never discussed in the Exxon advertising or one the Exxon websites to which the advertisements link.

Implications

The advertisements that trumpet Exxon’s role in pushing algae seem to have been the most frequent ads on the FT for the last weeks and months. Most of us have a deeply held view that freedom of speech demands that media such as the Financial Times are obliged to accept advertisements from whomever wants to advertise. So we reluctantly accept the Exxon insertions.

Are we correct in this opinion? In view of the existential threat from climate change, written about very effectively by the FT’s chief economics commentator Martin Wolf just this week, should not the newspaper demand that its fossil fuel advertisers present a fuller and more accurate view?[5] Should large companies be allowed to push marketing at us that distorts the reality of what they are doing? Exxon is one of the five most important polluters on the planet. Is it right that it is able to use advertisements that are intended to artificially inflate the public perception of the seriousness of its own efforts to wean itself off fossil fuels?

I find this a very uncomfortable dilemma but I’m beginning to think that polluters may need to be restrained.


Appendix: algae as the source of fuel

The oil we extract from the ground today largely comes from the decomposition of prehistoric algae. These tiny organisms contained about 20% lipids, a form of fat, which eventually pooled into the oil that is being produced today from fields around the world.

Exxon is trying to find ways of replicating the natural process. It wants to grow algae in large open-air reservoirs, harvest the product, dry it and then extract the fats efficiently. The fat can be relatively easily converted to liquids that can fuel conventional cars. Its research since 2009 has been focused on increasing the fat content of the organism. Genetic engineering of a particular strain of algae has pushed the percentage up to 40%, with only a small diminution in the rate of growth, the company claims.

 As it grows, algae use photosynthesis to convert CO2 in the atmosphere into useful oil. When extracted from the organism, the oil can therefore be said to be low-carbon. In fact, as I mention above, Exxon says that fuel derived from algae is approximately half as carbon-intensive as conventional oil. Others are far more sceptical about the carbon benefits of this route to making fuels.

[1] https://www.nytimes.com/2009/07/14/business/energy-environment/14fuel.html

[2] https://archive.nytimes.com/www.nytimes.com/gwire/2009/07/14/14greenwire-exxon-sinks-600m-into-algae-based-biofuels-in-33562.html

[3] http://www.biofuelsdigest.com/bdigest/2018/05/24/back-to-the-future-all-over-again-exxonmobil-targets-algae-fuels-at-scale-by-2025-as-oil-prices-rise/

[4] https://theconversation.com/algal-biofuel-production-is-neither-environmentally-nor-commercially-sustainable-82095

[5] https://www.ft.com/content/b1c35f36-d5fd-11e8-ab8e-6be0dcf1871

The economics of power to fuels

Does it make financial sense to construct chemical plants that use surplus electricity to make liquid and gaseous fuels? This topic is rarely discussed in the UK but is an increasing focus of interest in the rest of Europe, and particularly in Australia.  As previous posts on this web have tried to suggest, full decarbonisation is completely impossible without such ‘power to gas’ and ‘power to liquids’ (or P2x).

In this short article I look at some of the results contained in a new presentation from Lappeenranta University of Technology (LUT) in Finland.[1] This shows that some P2x products are likely to be competitive with fossil fuel variants in 2030, even before carbon taxes

Source: Fasihi and Breyer, Synthetic Fuels and Chemicals, figures converted to US $. Market prices  converted to US $ per megawatt hour.

Source: Fasihi and Breyer, Synthetic Fuels and Chemicals, figures converted to US $. Market prices  converted to US $ per megawatt hour.

The work by Mahdi Fasihi summarises detailed investigations on the likely cost of P2x for a variety of chemical energy carriers, ranging from hydrogen to dimethyl ether, a potential diesel substitute. He and his colleague, Professor Christian Breyer, have built detailed flow charts that show how the chemical plants that make these fuels will operate, both in terms of process and thermodynamically. Standard industry software can then convert these flows into estimates of the full costs of these products.

Fasihi’s process charts assume that the hydrogen contained in fuels is entirely derived from water electrolysis. The carbon (where necessary) is shown as being distilled directly from air. Although direct air capture is still in its early infancy, LUT has been at the forefront of research into possible technologies through its involvement in the Soletair project.[2]

The cost of hydrogen produced by water electrolysis is dominated by the price of the renewable electricity used to generate it. Although the impact of the capital cost of the hydrogen generators is far from negligible, the price of electrolysers is falling very sharply as technology improves and bigger machines are built. Modern electrolysis machines are approximately 80% efficient, meaning that for every 1 unit of electricity used about 0.8 units of energy are made available in the form of hydrogen. (This ratio will improve slightly in years to come). Therefore electricity bought for €40 a megawatt hour will produce hydrogen at raw cost of €50 per MWh.

Fasihi assumes electricity costs will come down, particularly in areas of the world with the best renewable energy availability. The presentation looks in detail at the places where a combination of wind and PV will produce large amounts of electricity for very large numbers of hours per year. This measure called ‘full load hours’, with the best places offering high renewables generation for 6,000 or more hours per year, meaning that any P2x plants associated with them have a reliable source of power.

As is well known, Australia comes out well in the full load hour rankings, as do parts of Chile, including the Atacama desert, and Patagonia. Somalia has good numbers, as do Tibet and the Great Plains of the US. For us in the UK, the west coast of Scotland and the Hebridean islands also score very well. 

By 2030, parts of the world are expected to see full costs of electricity from renewables at around €17-20 per megawatt hour (about £15-18, $19-23). (This compares with wholesale prices today for all forms of electricity of about £50 in the UK). The researchers calculate that electricity in 2030 can produce hydrogen for about $41 per megawatt hour based on the likely costs of renewables.

How does this compare to the market price of hydrogen today? Hydrogen isn’t an easy commodity to price because most of the gas is made in refineries to serve the petrochemical processes there. It doesn’t change hands much. When it is traded, it is usually also shipped from its source to the customer and transport costs for hydrogen are high because it has to be shipped in liquid form at very high pressure. But, very roughly, hydrogen prices are between about $65 and $118 for a megawatt hour of energy content for traded gas.[3] Today’s hydrogen costs more to make, using natural gas as its key ingredient, than hydrogen from electrolysis will be in 2030 in large parts of the world.

Australia sees its huge resources of wind and solar as helping to build a hydrogen business, particularly for shipping to Japan. There the gas will be used for fuel cell cars, if Japan’s ambitions are successful. It probably doesn’t make sense for Australia to transport hydrogen but instead to merge the gas into ammonia (NH3, or three atoms of hydrogen and one of nitrogen). Ammonia uses much less space and doesn’t need to be heavily pressurized. It can be turned back into hydrogen gas at the destination.

Fasihi at LUT calculates that the full cost of ammonia in places such as Australia in 2030 will be about $72 a megawatt hour. This compares to $50 for ammonia delivered in bulk today.[4] But if ammonia can be cheaply converted back to hydrogen, ammonia may become the way in which hydrogen is transported. Importantly, the main Australian research organization in the energy field just demonstrated a successful trial of extracting 100% pure hydrogen from ammonia for filling up fuel cell cars.[5]

Methanol made from hydrogen and captured CO2 is almost as cheap in 2030 as this liquid would be today: $81 per megawatt hour compared to about $76 for the fossil fuel version. However at today’s CO2 prices of around $22 per tonne in Europe, synthetic methanol would be about the same price as the conventional product, which would be burdened by permit costs. About 60 million tonnes of methanol are made each year and it is one of the top five products made from oil but not used directly in cars. Hydrogen and ammonia are two of the others.

Fasihi’s numbers suggest that the difference between standard natural gas (mostly methane) and methane from power to gas processes is larger. In the table, I’ve shown today’s natural gas price in Japan, one of the world’s higher cost locations for this fuel. At $34 a megawatt hour, the price today is well below the price of natural gas made from renewable hydrogen and CO2 of around $66. The carbon prices of today would not cut substantially into this difference.

What should we conclude? First, synthetic methanol stands out as an obvious focus for a renewable fuel. Second, that hydrogen from electrolysis may be competitive in some circumstances. It can be used for local energy storage in particular, and then converted back to electricity in a fuel cell. By contrast, renewable methane looks expensive, particularly in places such as the US where natural gas is extremely cheap. Last, ammonia is particularly interesting because it can substitute for natural gas in CCGT power stations and can be made in relatively small quantities for local use as the key ingredient for fertilisers in remote places.[6] We can envisage microgrids that provide electricity but store surpluses as ammonia, either for food production or for combusting for electricity purposes at times of seasonal lows in renewable production.

Most important of all, we just need to do more work on the economics and practicality of synthetic fuel. Full decarbonisation demands it. And, in parts of the UK, we have the potential to produce very carbon fuels at prices lower than most of the world.

[1] I think this presentation is absolutely outstanding. LUT has produced much of the most insightful research, both practical and academic, into P2x. Fasihi’s work summarises and extends existing knowledge. https://www.strommarkttreffen.org/2018-06-29_Fasihi_Synthetic_fuels&chemicals_options_and_systemic_impact.pdf

[2] https://www.lut.fi/web/en/news/-/asset_publisher/lGh4SAywhcPu/content/finnish-demo-plant-produces-renewable-fuel-from-carbon-dioxide-captured-from-the-air

[3] Source: $65 Northern Gas Networks https://www.northerngasnetworks.co.uk/wp-content/uploads/2017/04/H21-Report-Interactive-PDF-July-2016.compressed.pdf (p. 260); $118 McKinsey https://www.mckinsey.com/~/media/McKinsey/Business%20Functions/Sustainability%20and%20Resource%20Productivity/Our%20Insights/How%20industry%20can%20move%20toward%20a%20low%20carbon%20future/Decarbonization-of-industrial-sectors-The-next-frontier.ashx (p. 58).

[4] Source: Methanex published prices.

[5] https://www.abc.net.au/news/2018-08-08/hydrogen-fuel-breakthrough-csiro-game-changer-export-potential/10082514

[6] See the Proton Ventures web site https://protonventures.com/ for some details of small-scale Haber Bosch plants.